Reporting & Analytics
Primavera P6 holds the data; it has never been famous for presenting it. Reporting teams burn days every cycle exporting, reshaping and pasting into slides — and management still cannot see the one number they asked for.
I build the reporting layer that ends that cycle: Oracle BI Publisher / Analytics Publisher for the P6-native reports and forms, Microsoft Power BI for management dashboards, connected properly to the P6 database or APIs and refreshed automatically.
Not sure what to ask for? The report & dashboard catalog shows 34 reports and 8 role-based dashboards as sample designs — browse it before we talk, and the first meeting starts halfway done.
The right tool for each job
BI / Analytics Publisher is the right tool when the output must live inside the P6 world: pixel-perfect scheduled reports, layouts your planners trigger from the environment itself, documents that follow your corporate templates.
Power BI is the right tool when the audience is management: portfolio dashboards, S-curves, earned-value views, progress and manpower trends — interactive, refreshed on schedule, and combinable with cost or ERP data. I have built both stacks for years and will tell you honestly which one (often: both, in different roles) your requirement needs.
How the work runs
We start from the decisions, not the charts: what does each audience need to decide weekly and monthly? That defines a short KPI catalogue. Then I build the data connection (database views or API, depending on your environment and IT policy), the reports and dashboards, and the automated refresh — and document all of it so your team can extend it.
Where P6 alone cannot answer the question — combined cost/schedule views, multi-source portfolio pictures — the same engagement can pull in integration work.
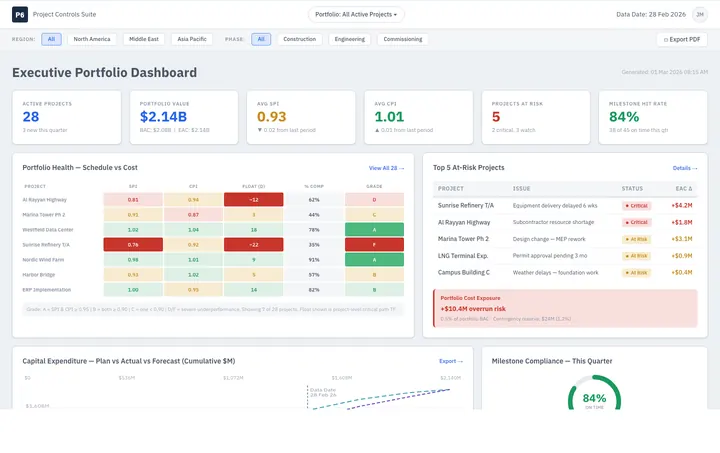
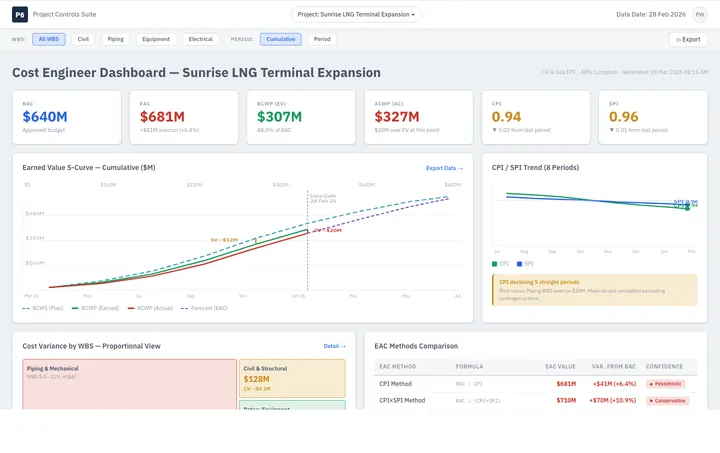
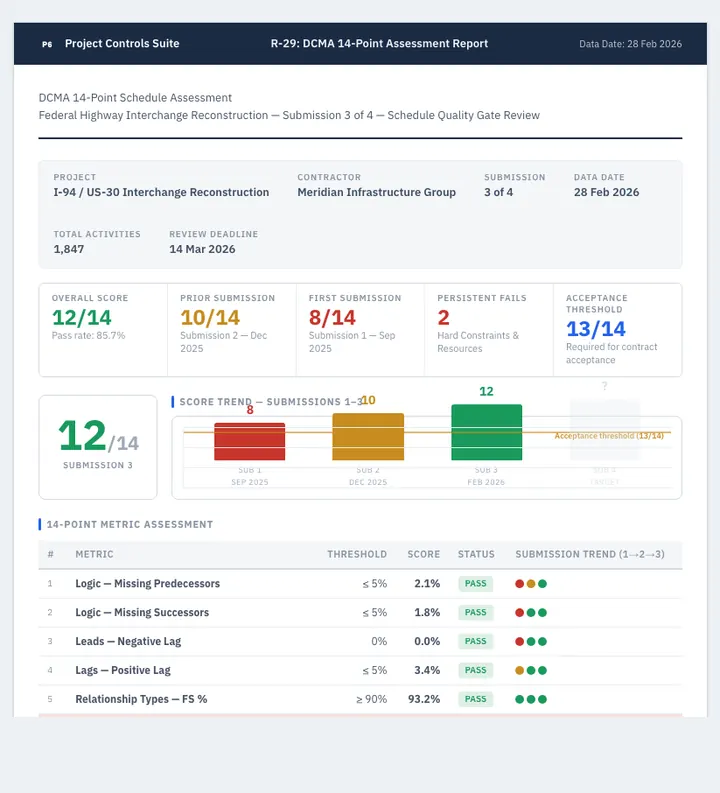
Report & dashboard catalog
34 reports and 8 role-based dashboards — each paired with the question it answers and the person who asks it. Browse it like a menu, not a specification.
Browse the catalog →Frequently asked questions
Direct database access or API?
Depends on your deployment and IT policy. On-premise environments often allow read-only database views (fast, robust); cloud environments push towards APIs. I have shipped both and will design for what your IT will actually approve.
Can you rescue our existing reports instead of rebuilding?
Often, yes. Many reporting stacks fail on the data connection or refresh discipline, not the layouts. A short review tells us whether to repair or rebuild.
Do the dashboards update themselves?
Yes — that is the point. Refresh runs on schedule; nobody exports XER files into spreadsheets at 11 pm before the progress meeting.