Report & dashboard catalog
Most P6 reporting engagements start with the same conversation: “what could we be looking at that we currently are not?” This catalog is that conversation, laid out — every report tied to the question it answers and the person who asks it. Browse it the way you would a menu, not a specification.
Sample designs — illustrative data. The visuals on this page are design samples from the PlanP6 report pack, currently in development; all project names and figures are fictitious. Every deliverable is adapted to your coding structure, UDFs and reporting cycle — the catalog is a starting point, not a boundary.
Dashboards
8 role-based dashboards — each designed around the question one person asks every morning.
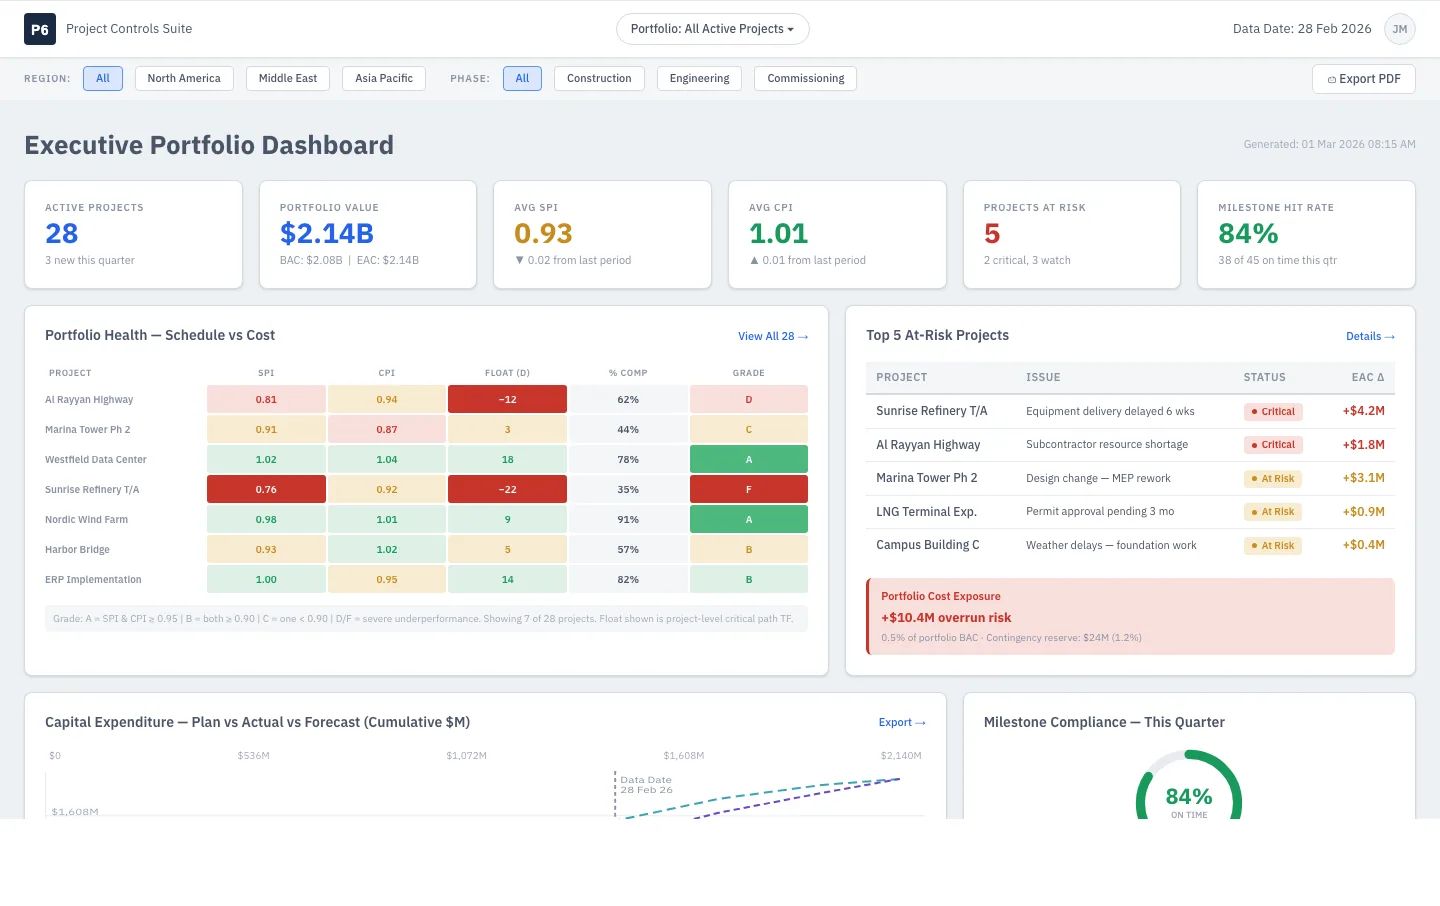
Executive Portfolio Dashboard
I have 30 active projects. Which ones need my attention right now — and where is my capital at risk?
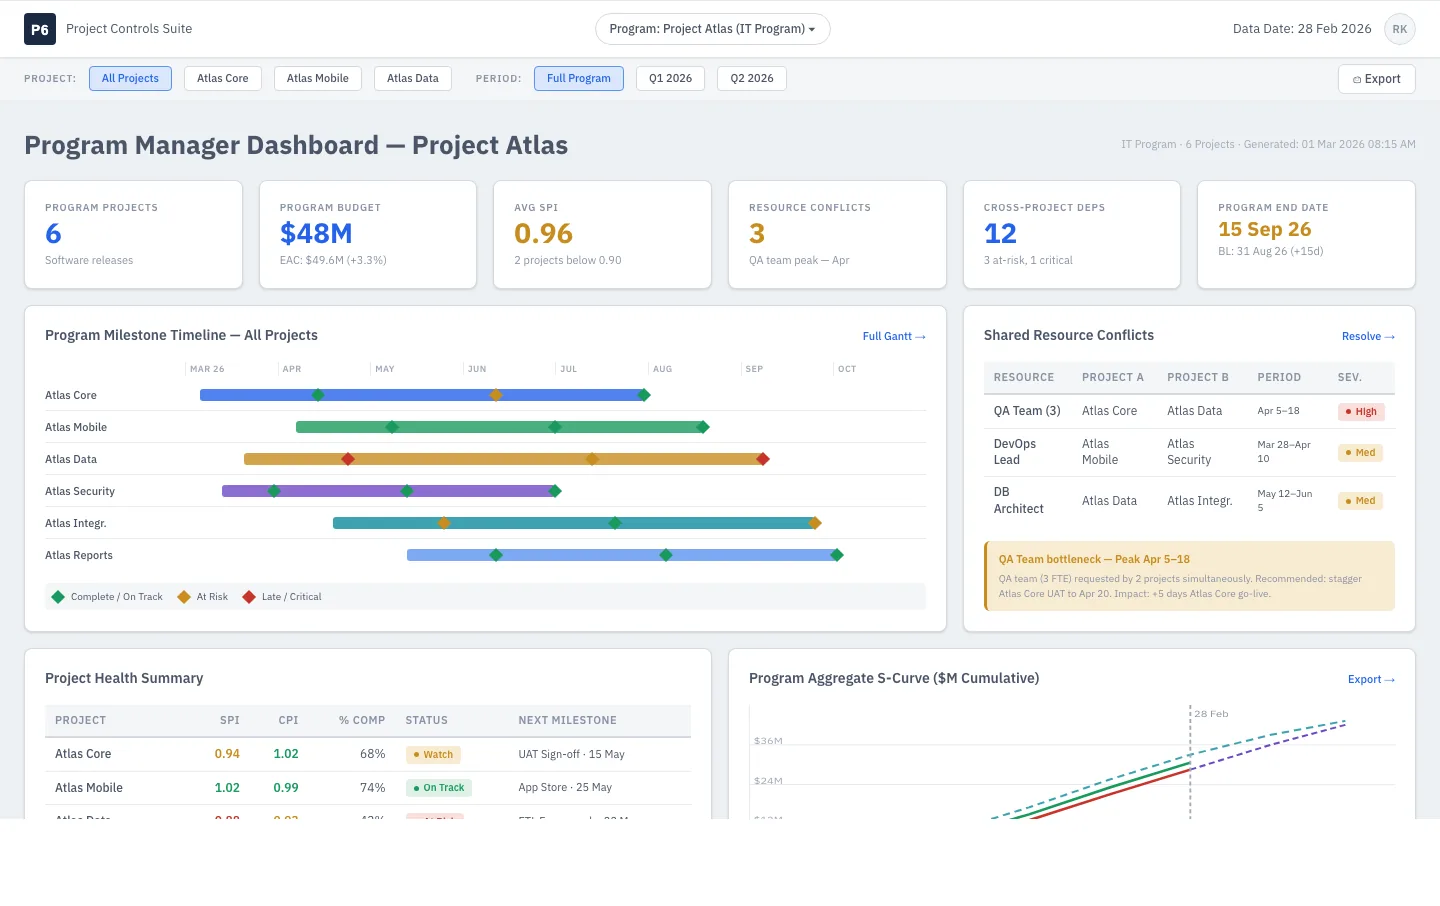
Program Manager Dashboard
I run 5–8 related projects. Show me cross-project dependencies, shared-resource conflicts and which project is dragging the programme down.
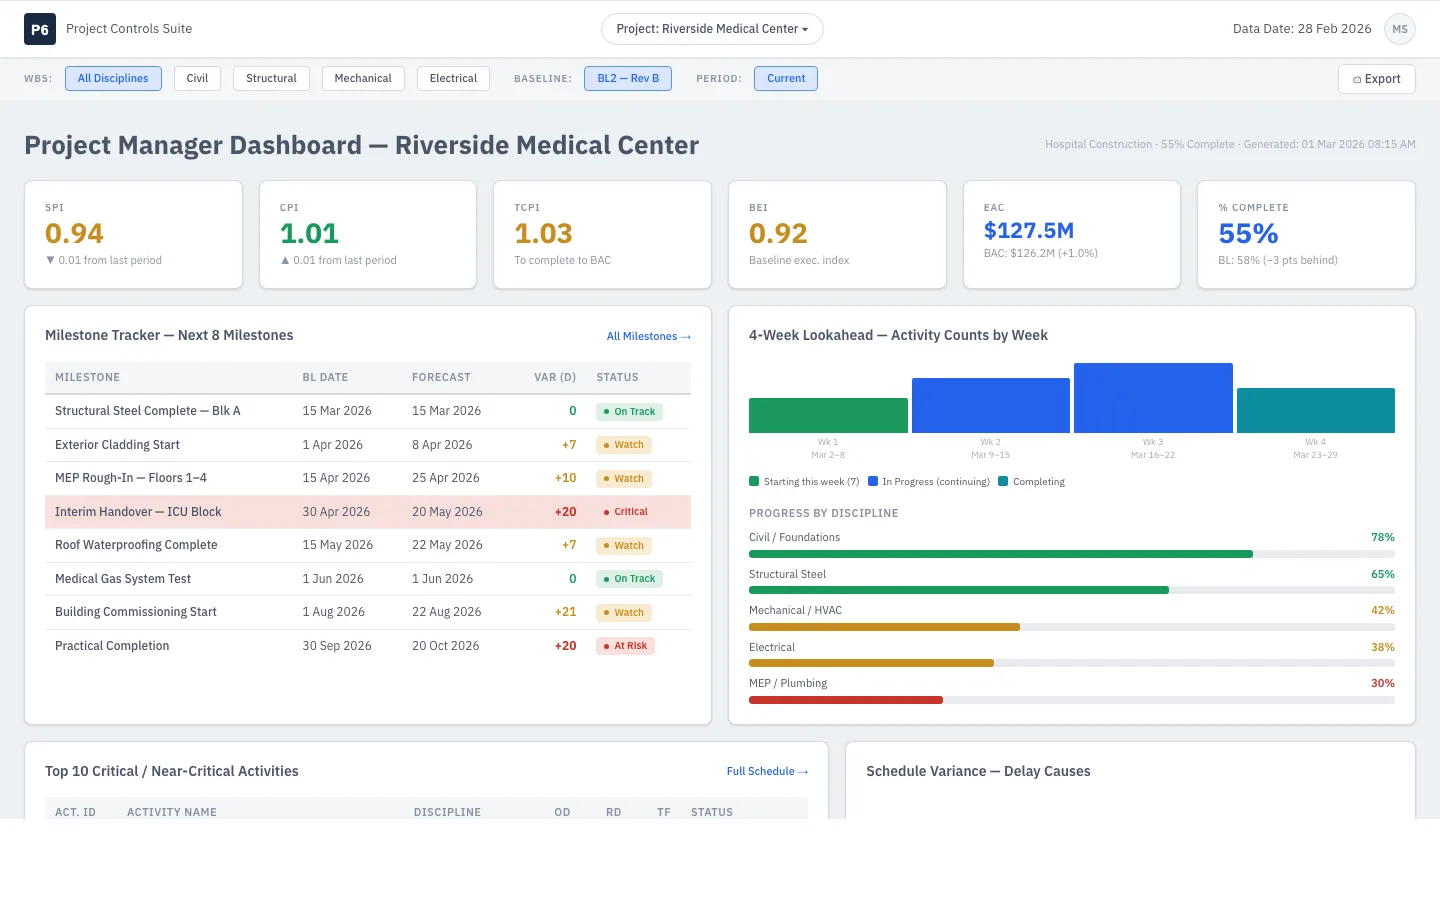
Project Manager Dashboard
The single-page truth of my project: schedule health, cost position, upcoming milestones, and what is going wrong.
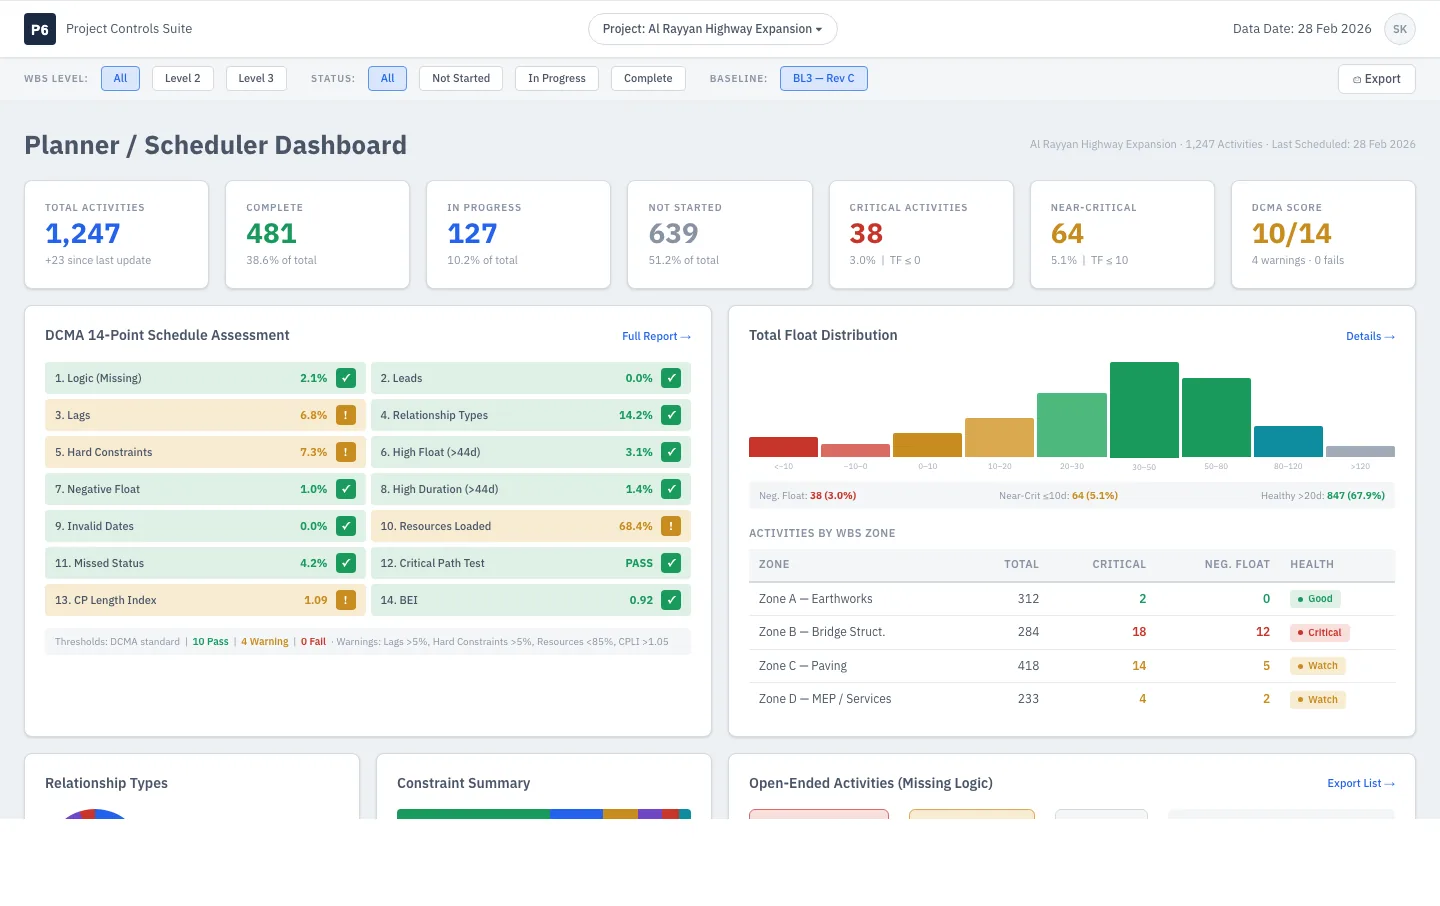
Planner / Scheduler Dashboard
Schedule quality at a glance: DCMA 14-point results, float trends, logic issues — audit-ready at any moment.
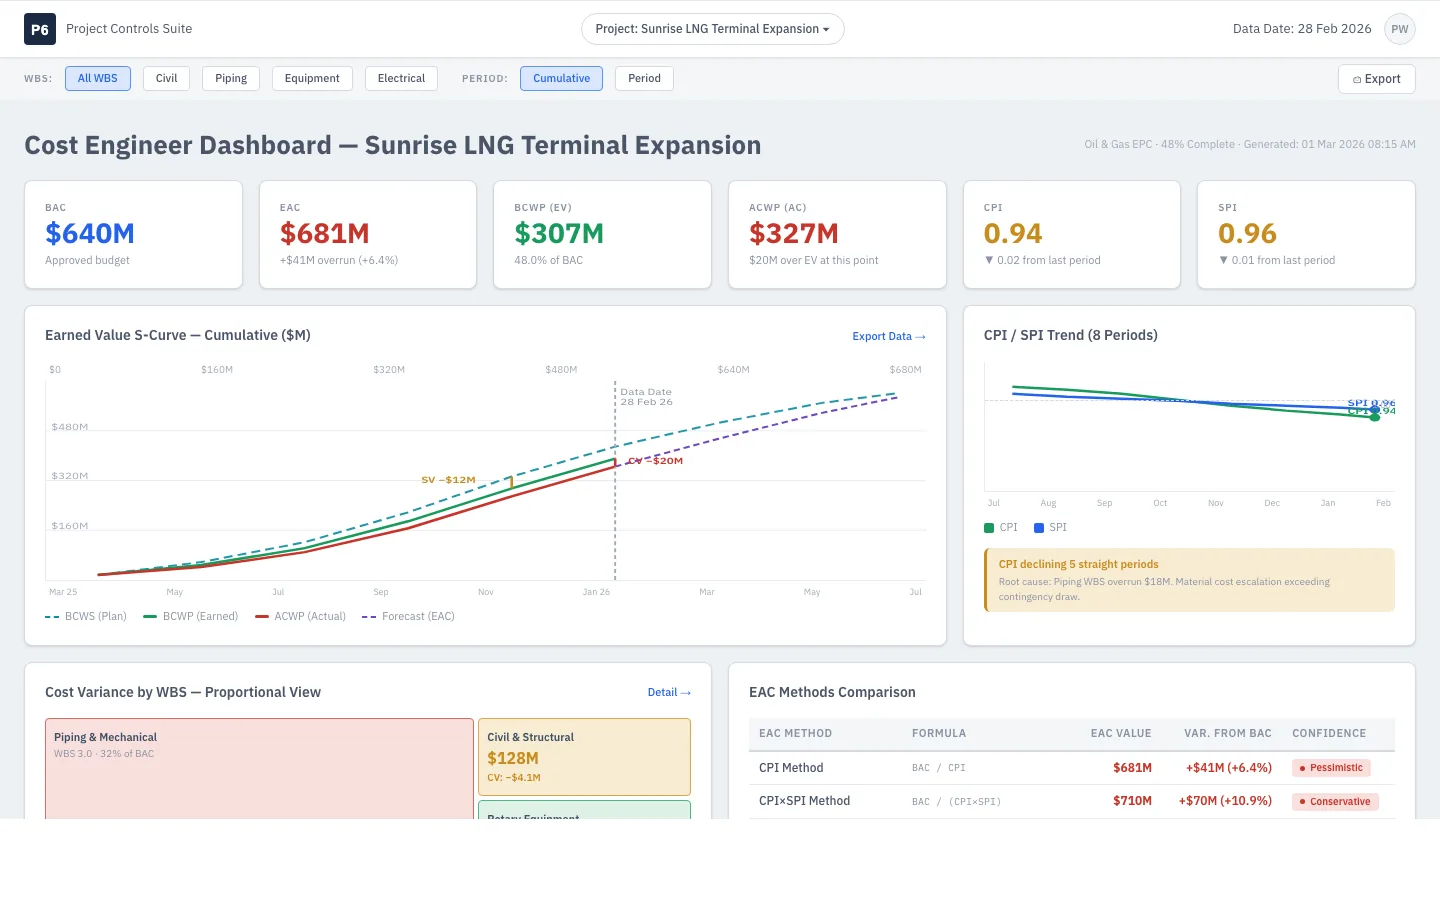
Cost Engineer Dashboard
Where is the budget going, what is earned versus spent, and what will the final cost be — S-curves, EAC trend, variance by WBS.
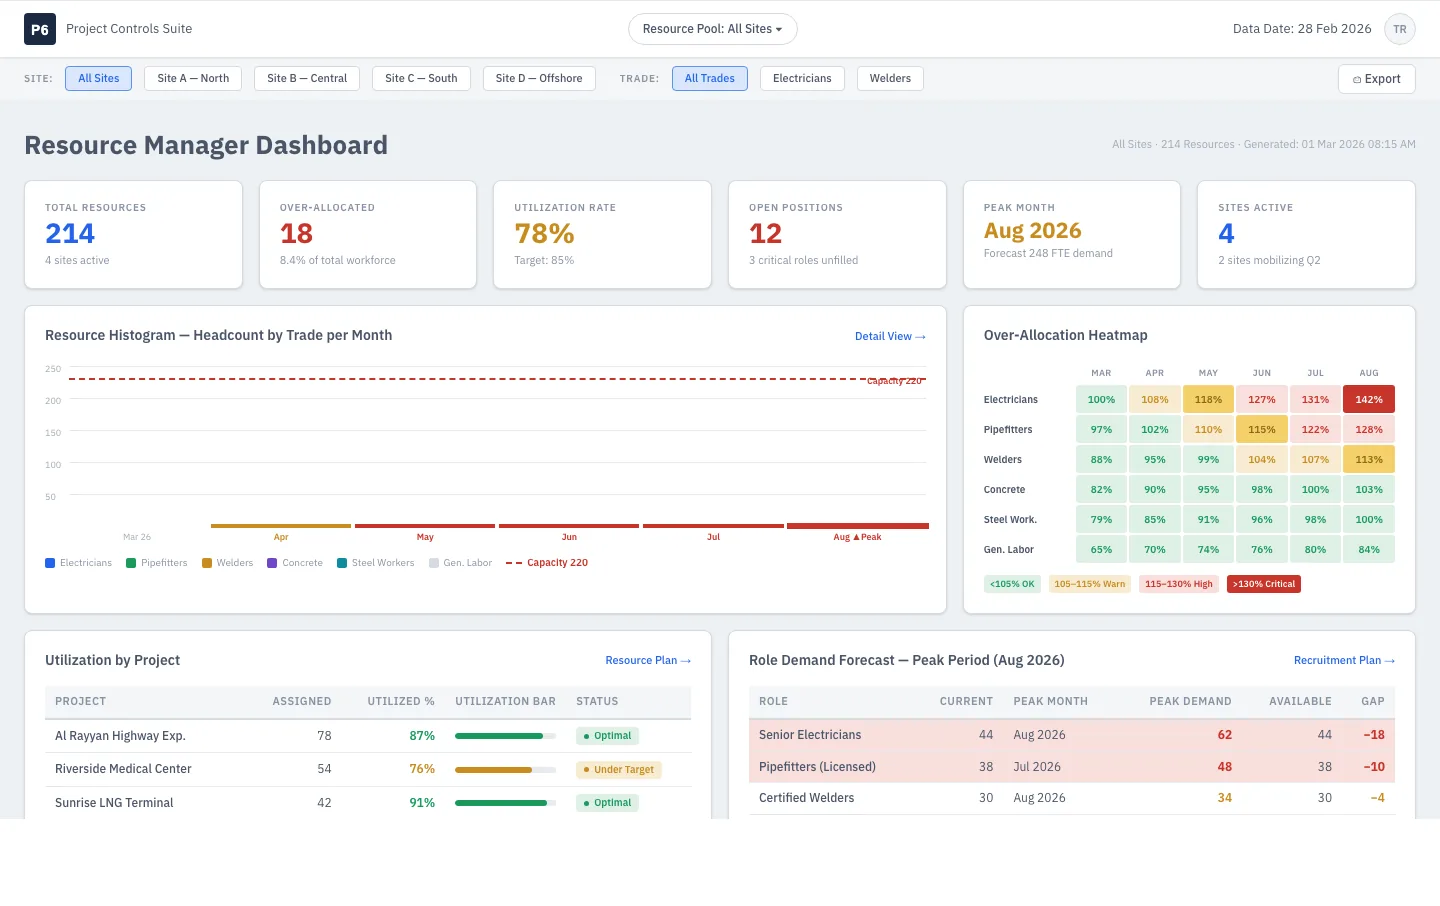
Resource Manager Dashboard
Who is over-allocated, where are the gaps in the next three months, and which projects are competing for the same people?
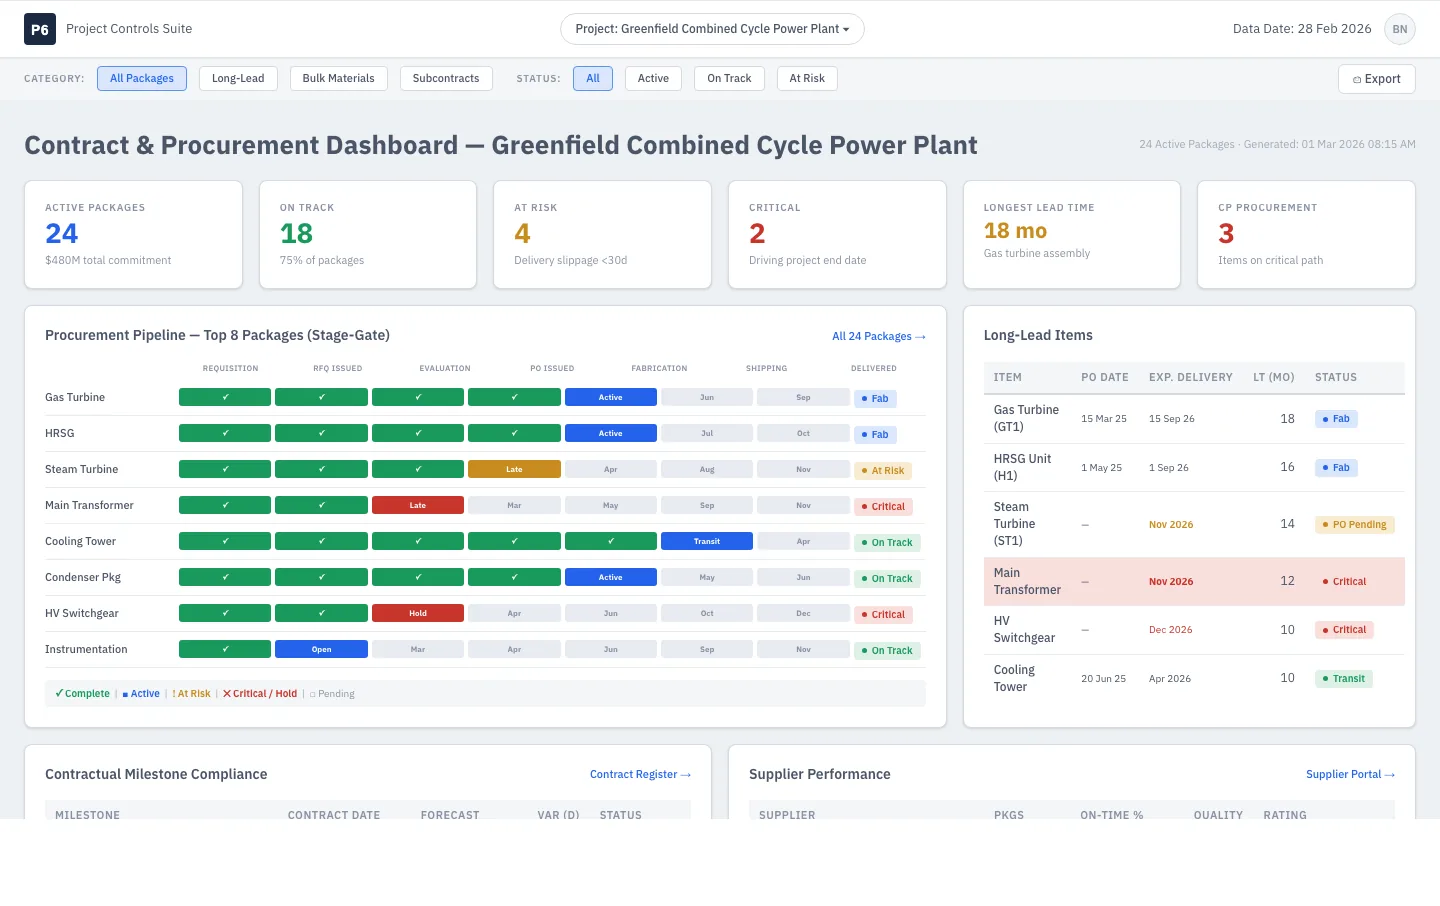
Contract & Procurement Dashboard
Which procurement items sit on the critical path, where is the lead-time risk, and are we meeting contractual milestones?
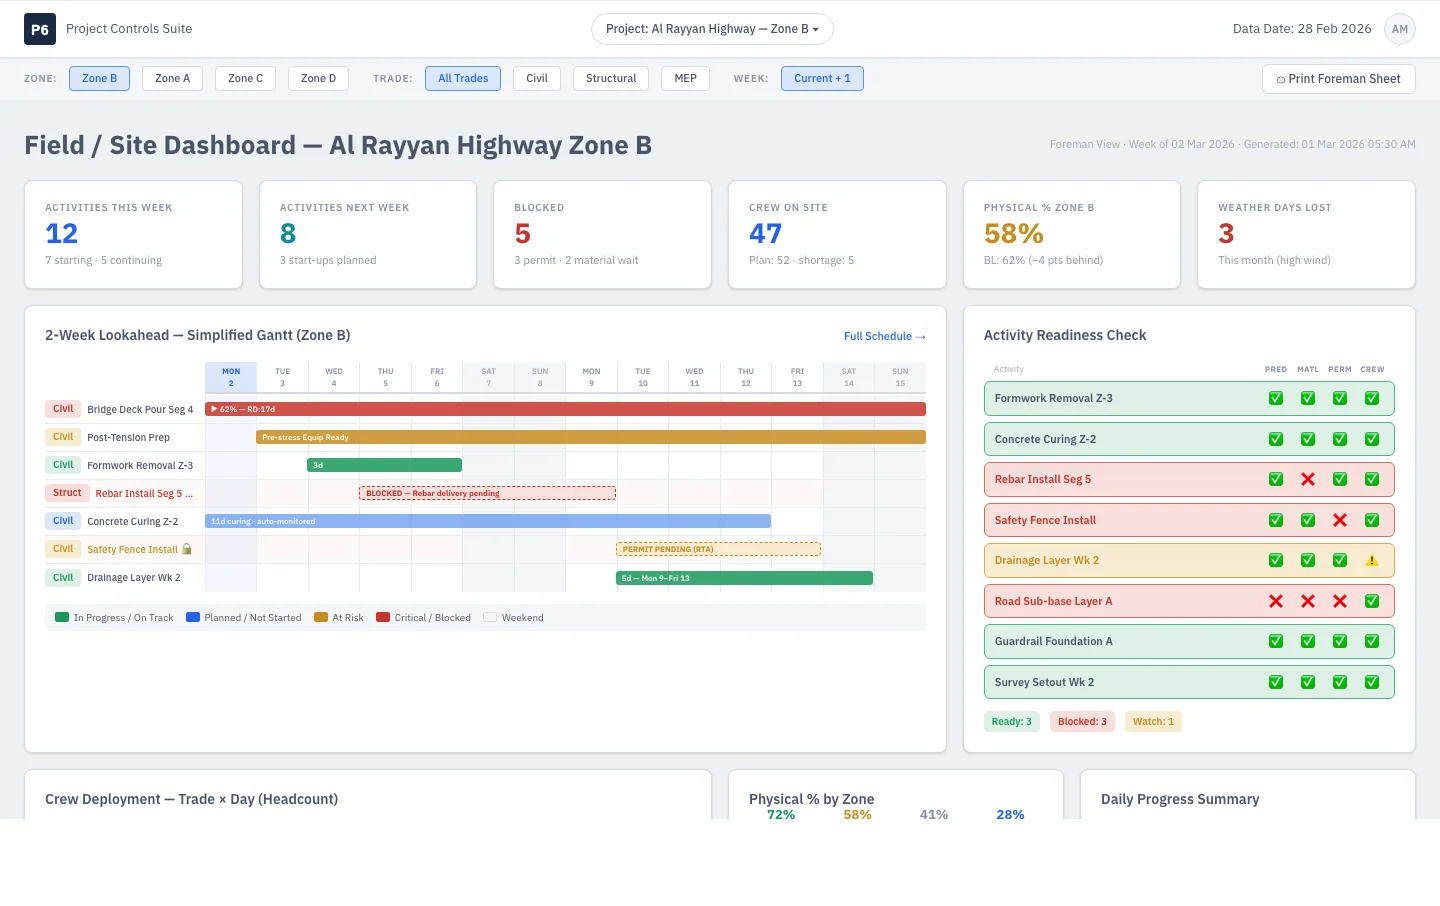
Field / Site Dashboard
What does the site need to do this week and next, what are the prerequisites, and what is blocking us?
Reports
34 reports arranged across the seven phases of a project lifecycle — from pre-baseline validation to the as-built archive.
Phase 1 — Initiation & Baseline
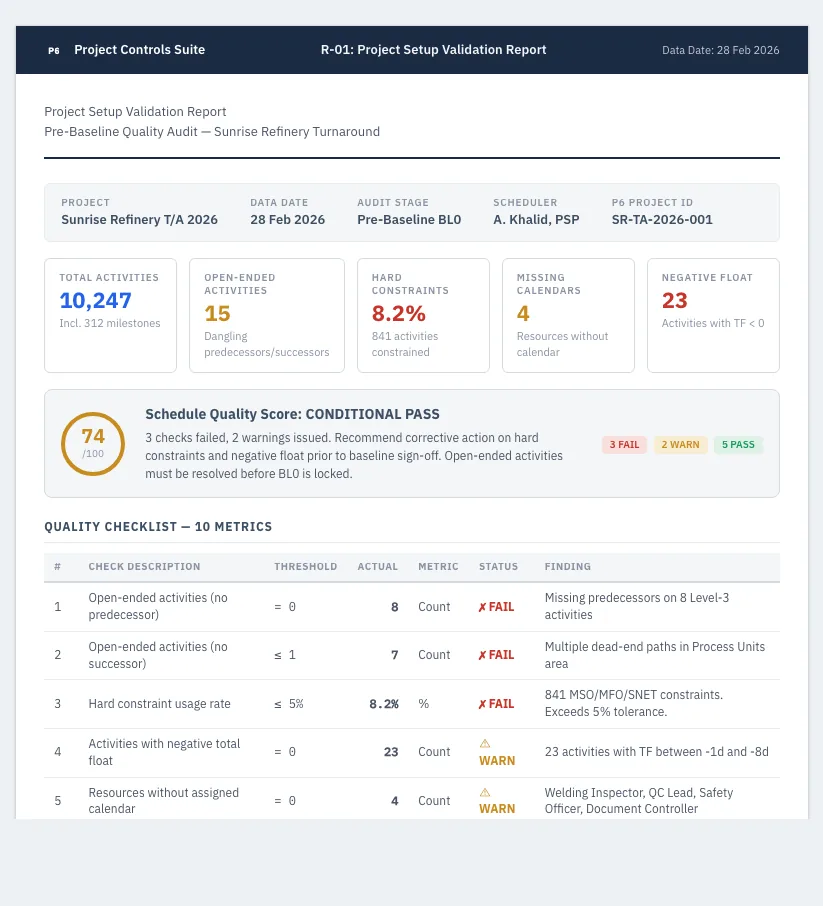
Project Setup Validation
Before we baseline: is the schedule structurally sound? Missing logic, open ends, invalid dates?
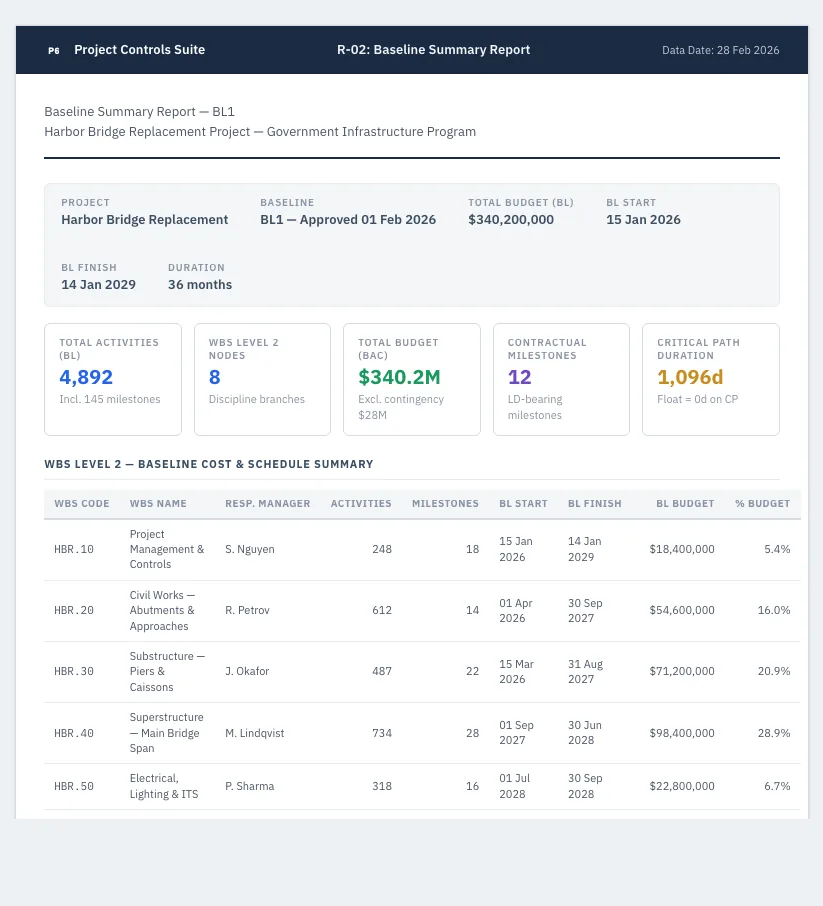
Baseline Summary
A clean record of what we committed to — milestones, durations, budget — as the official reference.
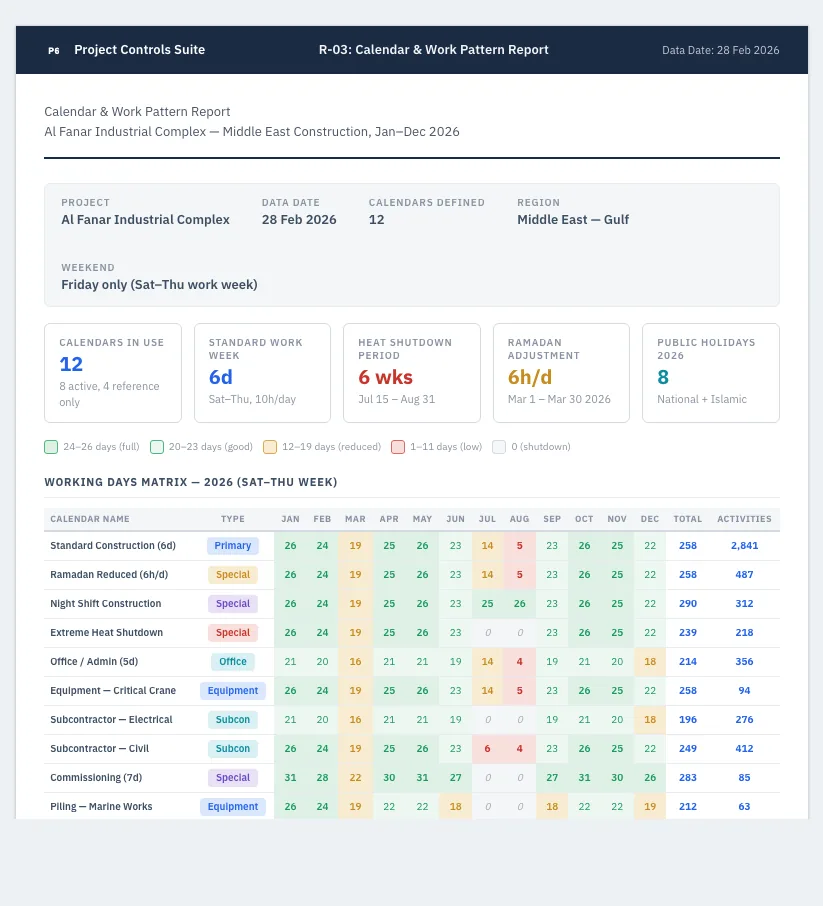
Calendar & Work Pattern
Twelve calendars, different shifts, holidays and weather windows — are they all set up correctly?
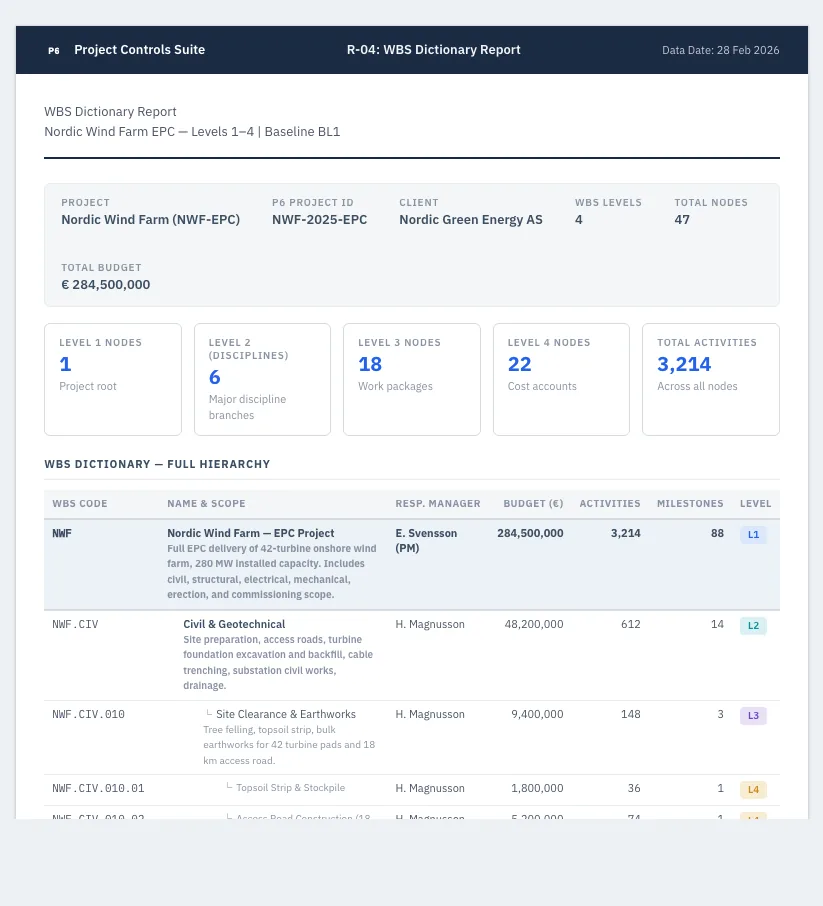
WBS Dictionary
A formal WBS dictionary mapping every node to scope, responsible person, budget and account code.
Phase 2 — Execution & Progress
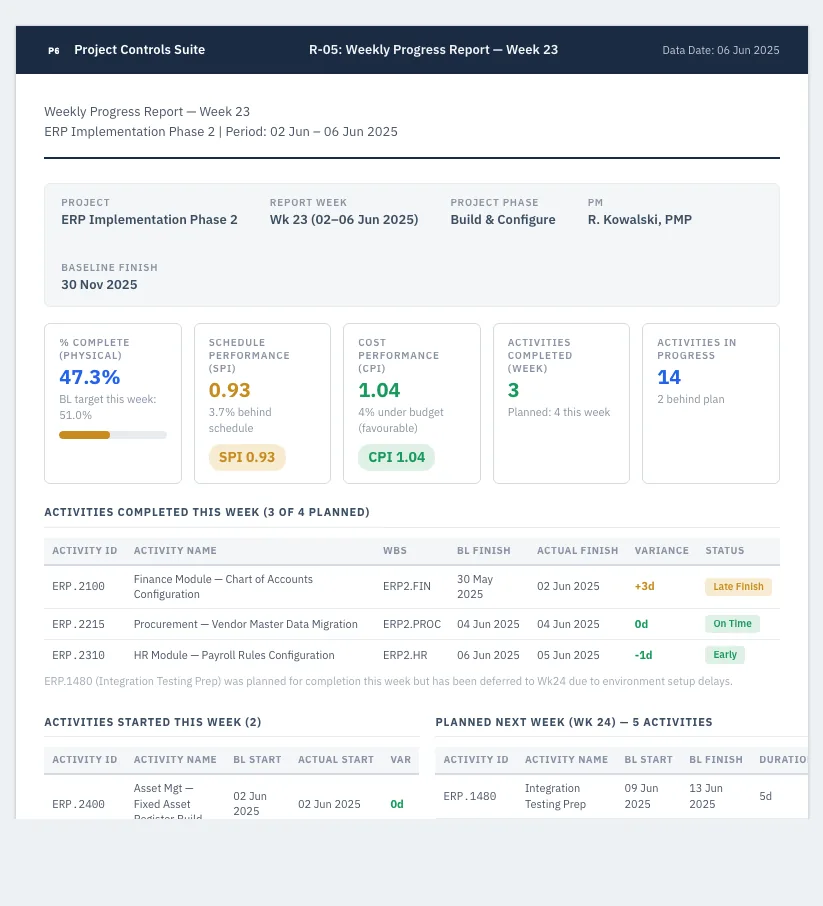
Weekly Progress
Every Friday: what we did, what is next, what is at risk — without four hours of manual compilation.
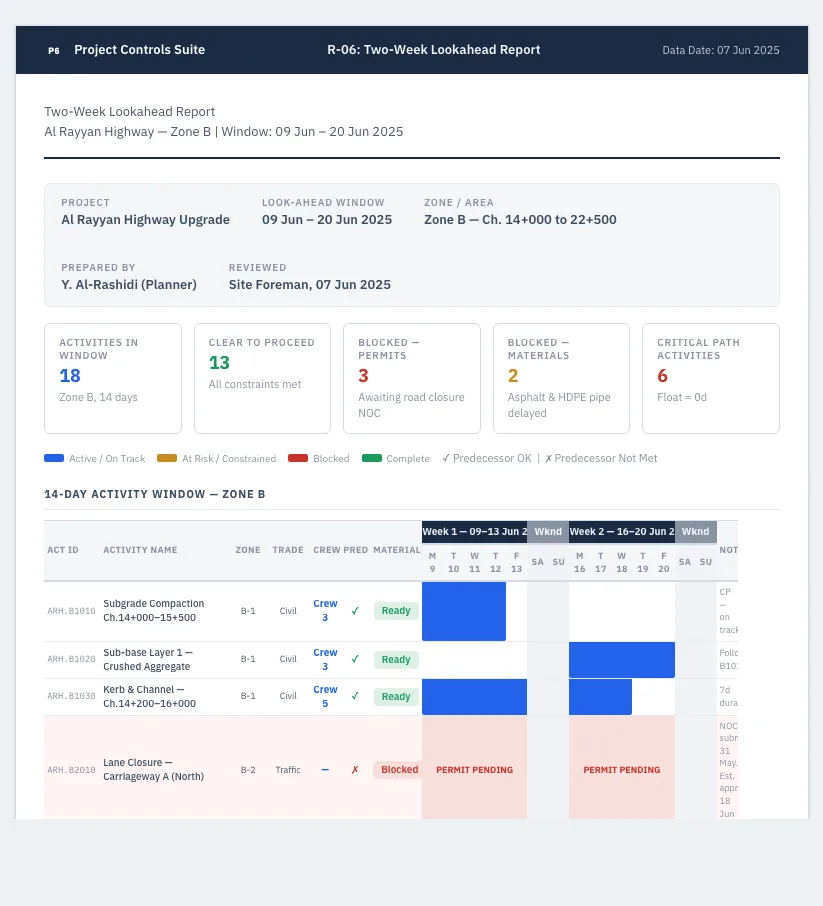
Two-Week Lookahead
What starts or continues in the next 14 days — with prerequisites, crew needs and materials.
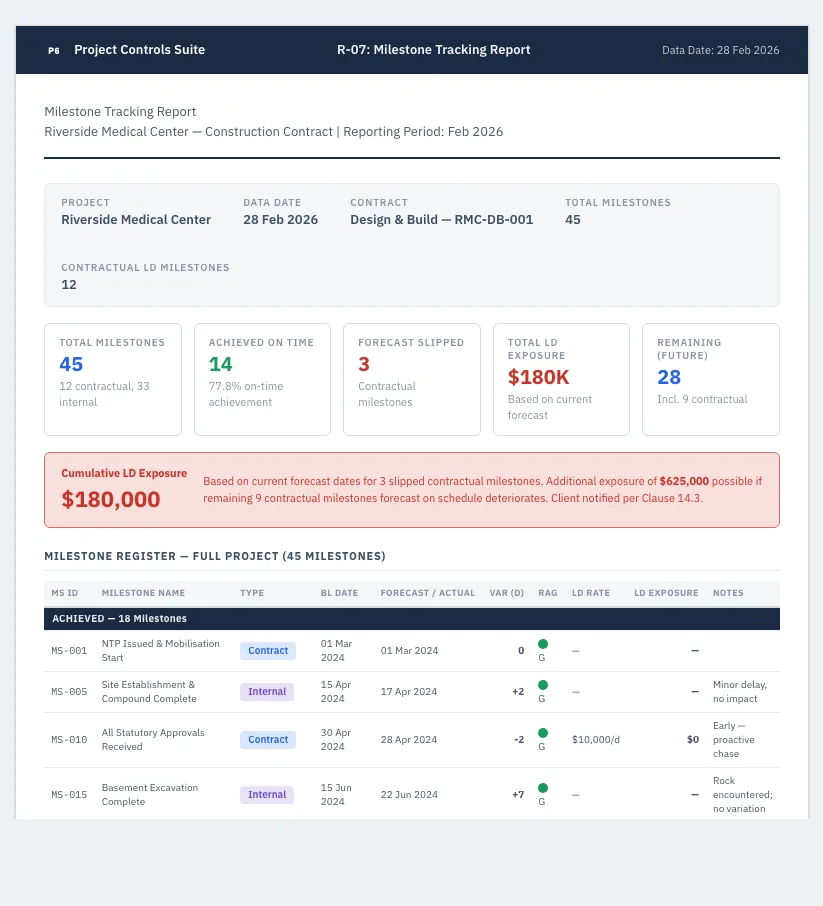
Milestone Tracking
45 contractual milestones: which did we hit, which are slipping, what is the liquidated-damages exposure?
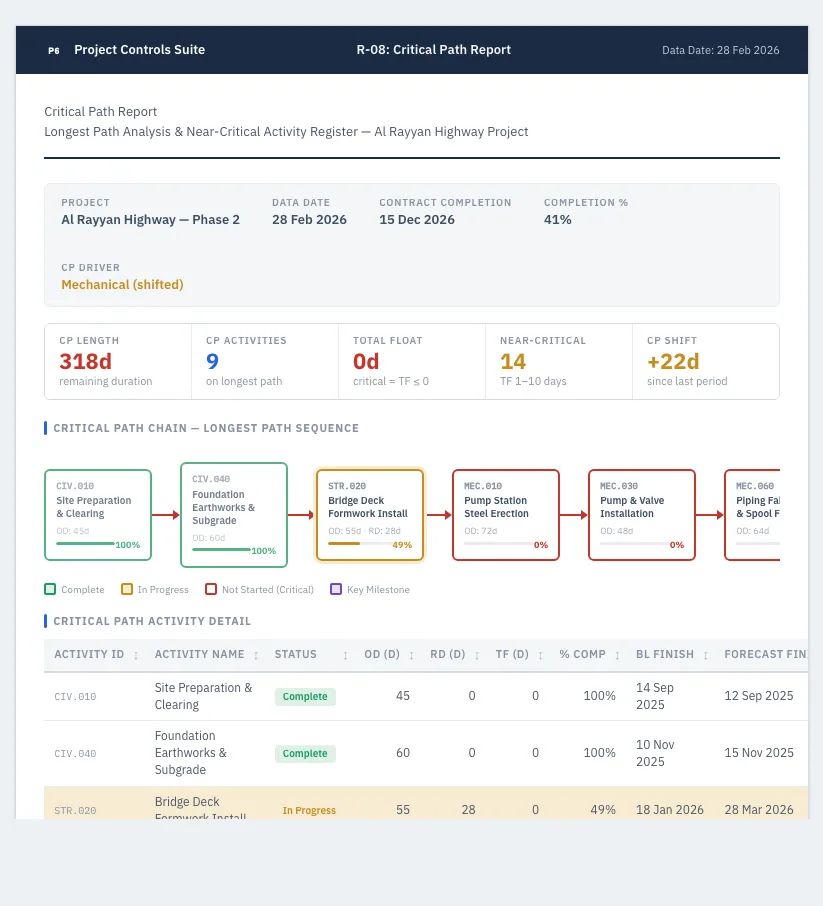
Critical Path
What is driving the end date? Show me the chain that moves the project if it slips one day.
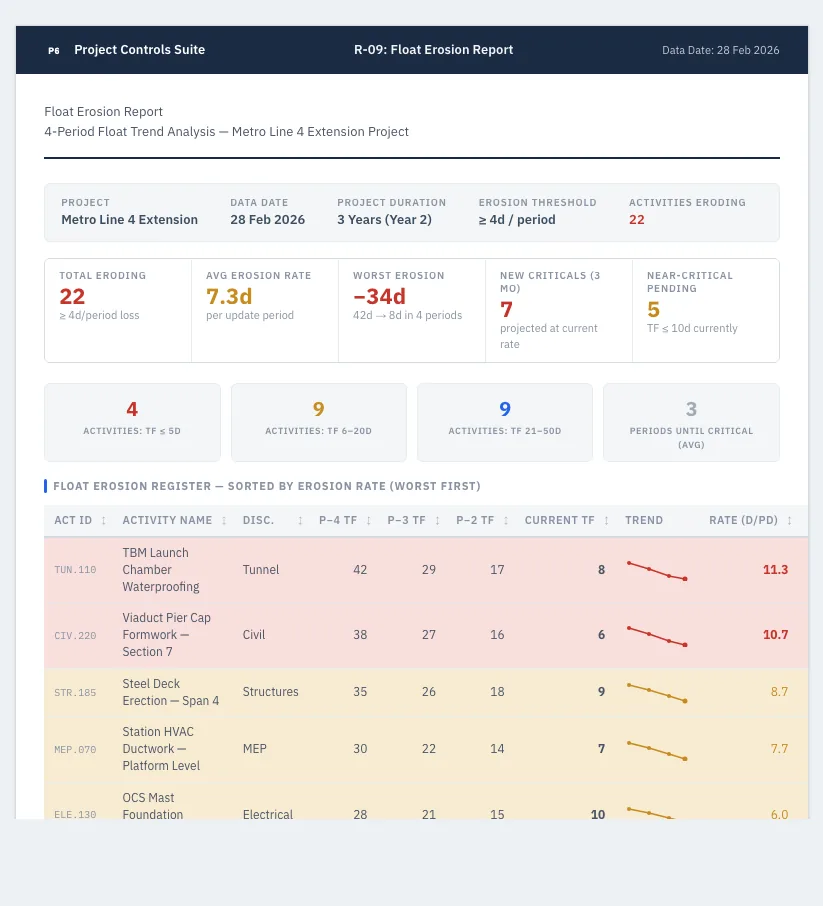
Float Erosion
Activities that had 20 days of float now have 5. Not critical yet — but they will be. Early warning.
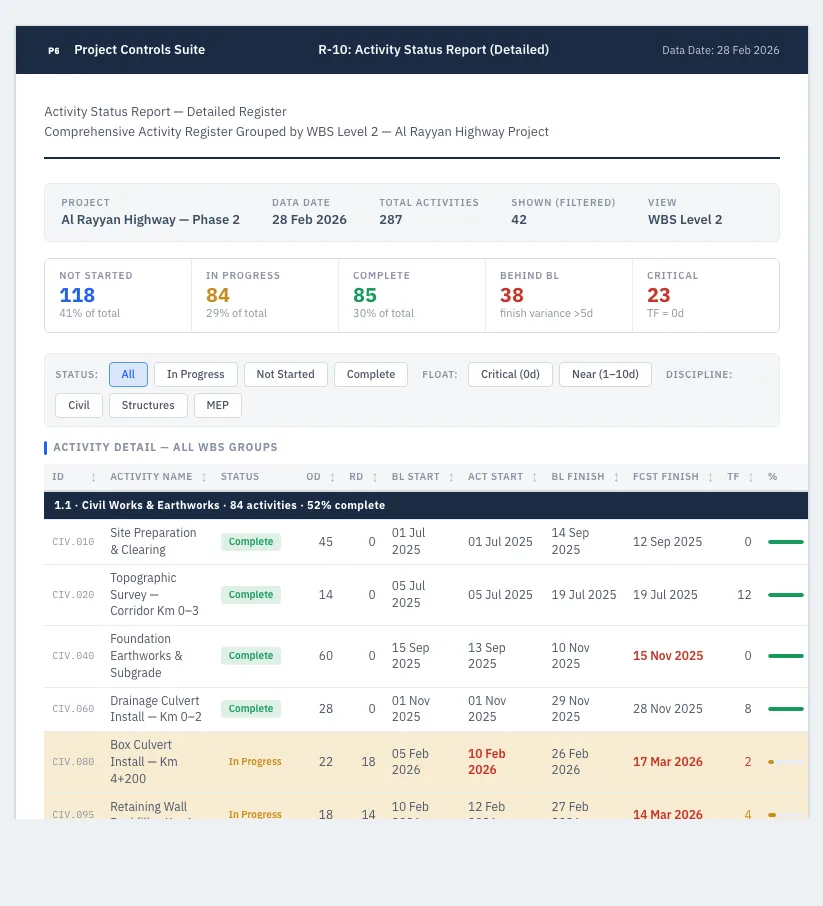
Activity Status (Detailed)
The full picture of every activity — status, dates, float, resources, logic — filterable by any code.
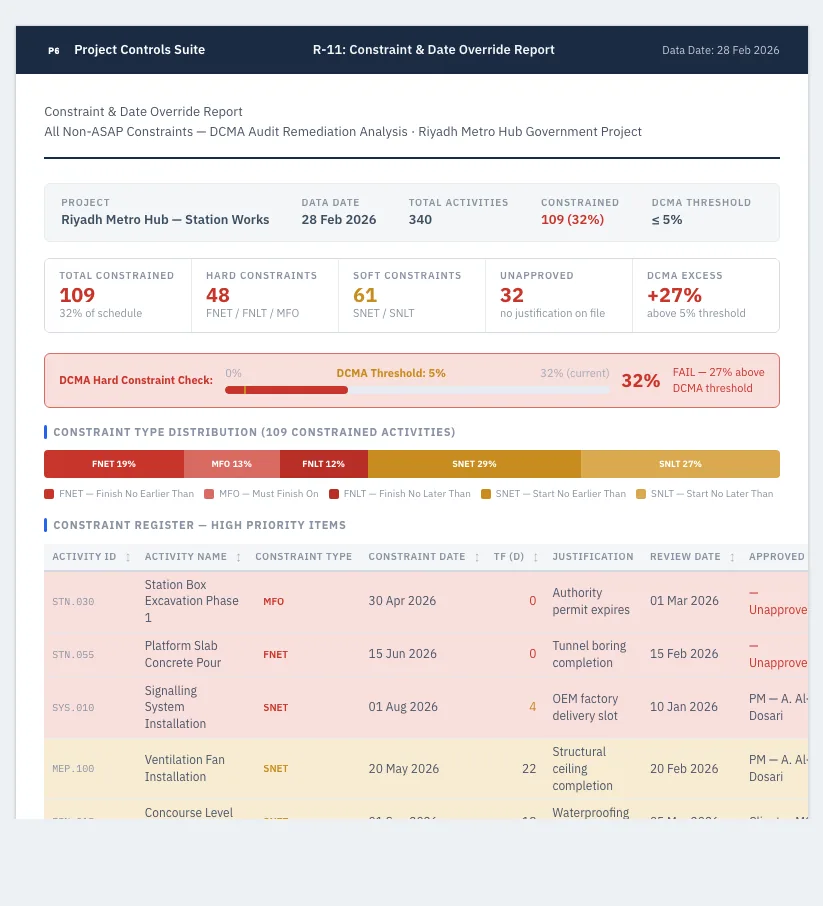
Constraint & Date Override
Every constrained activity, why it is constrained, and whether the constraint is still valid.
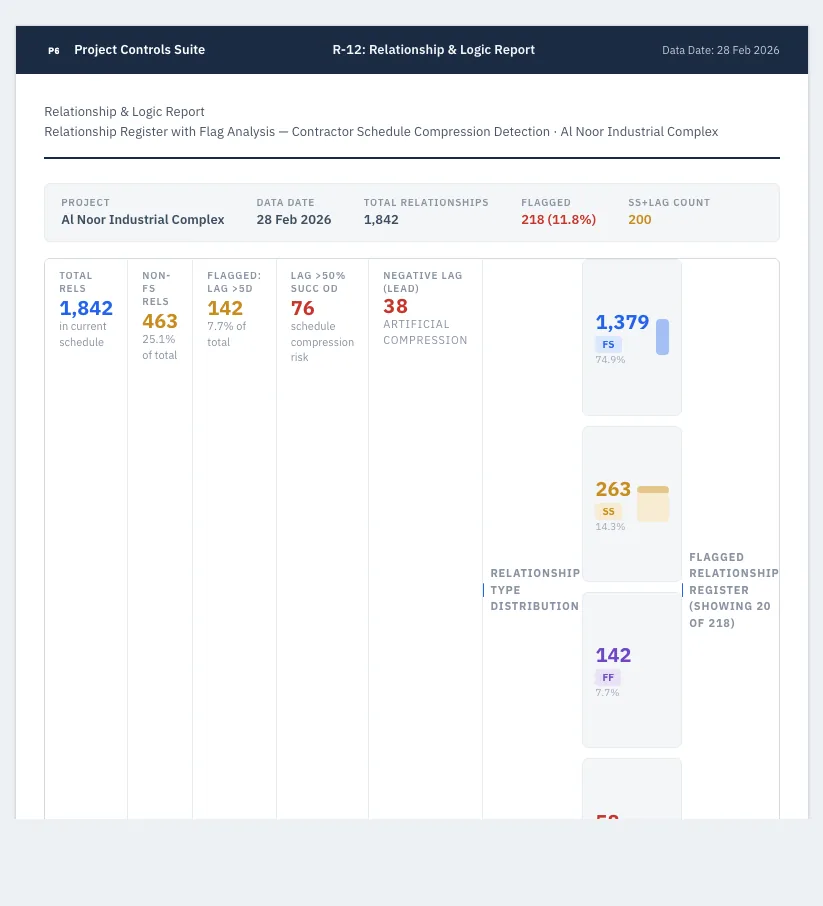
Relationship & Logic
Excessive lags, SS/FF links that may hide logic issues, and redundant relationships — all in one review.
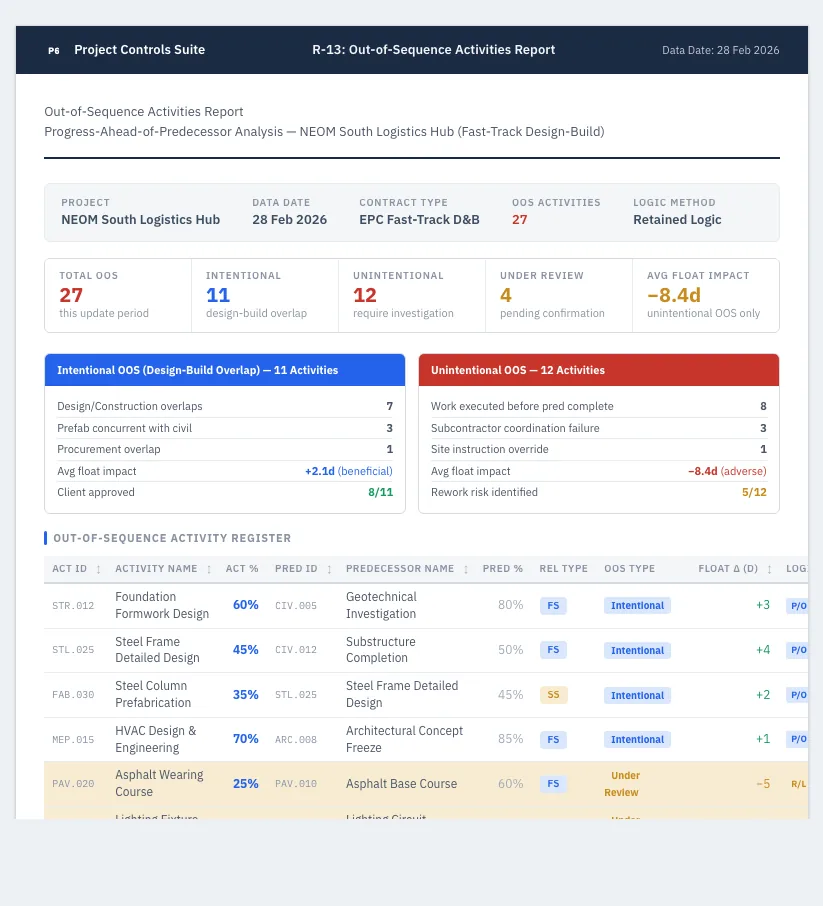
Out-of-Sequence Activities
Activities that started before their predecessors finished break CPM logic. Which ones, and what is the impact?
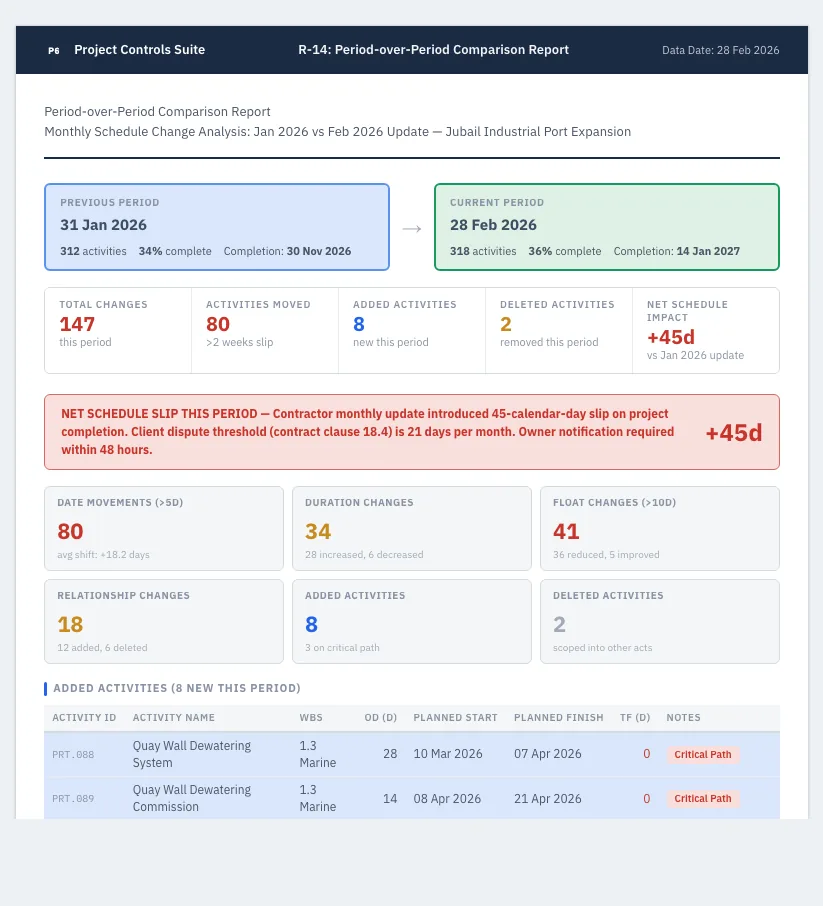
Period-over-Period Comparison
What changed between this update and last month’s? New and deleted activities, date shifts, float changes.
Phase 3 — Earned Value & Cost
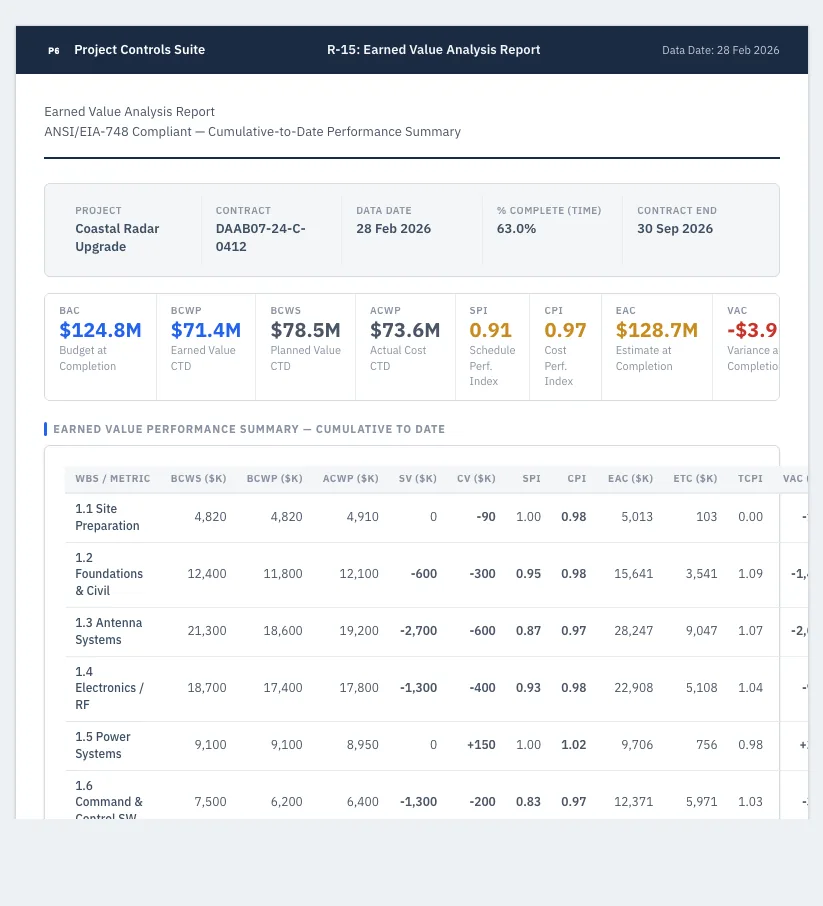
Earned Value Analysis
BCWS, BCWP, ACWP, SPI, CPI, EAC, TCPI, VAC — the full earned-value position in one place, with trend.
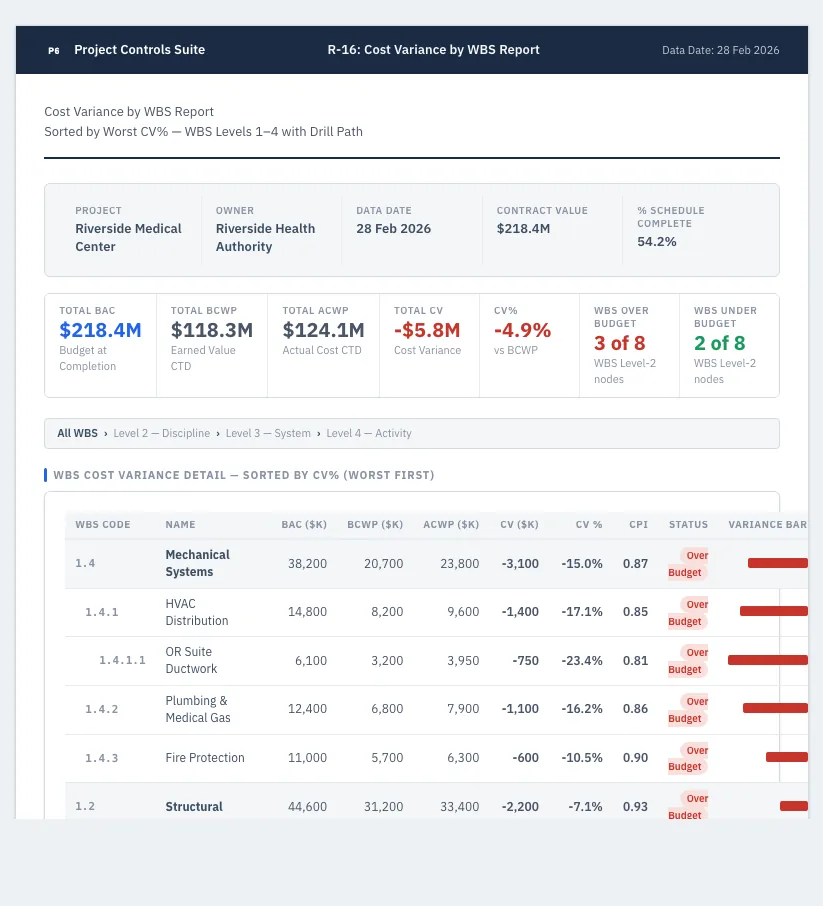
Cost Variance by WBS
Where exactly is the overrun? Which WBS nodes contribute most to the cost variance?
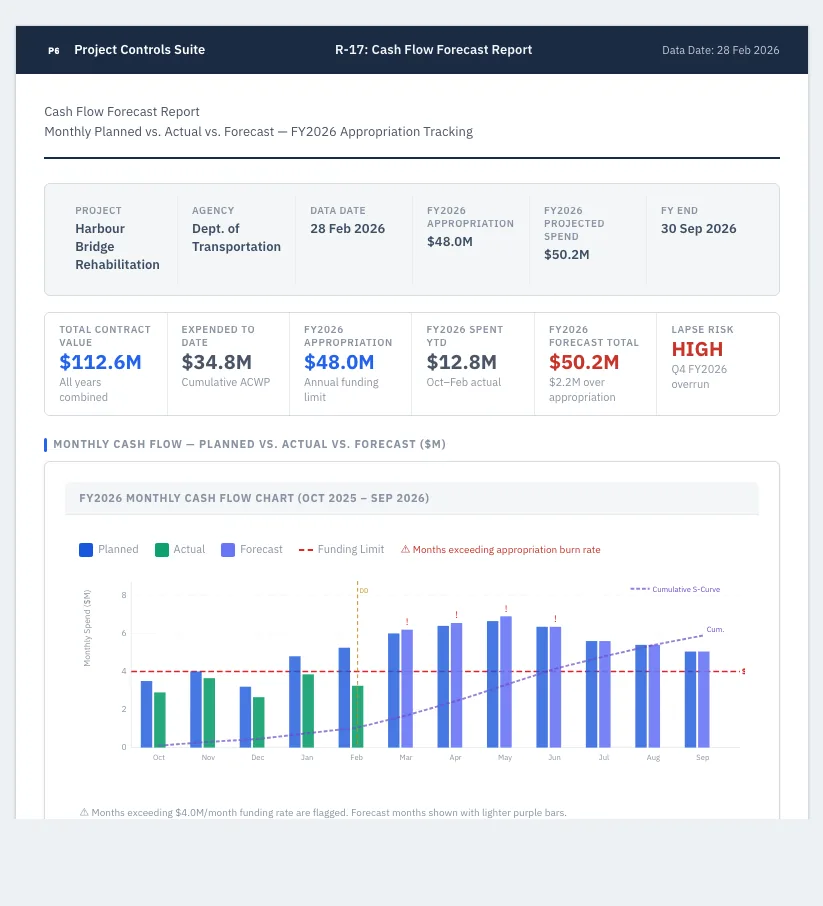
Cash Flow Forecast
Monthly and quarterly cash-flow projection for the remainder of the project, against the funding plan.
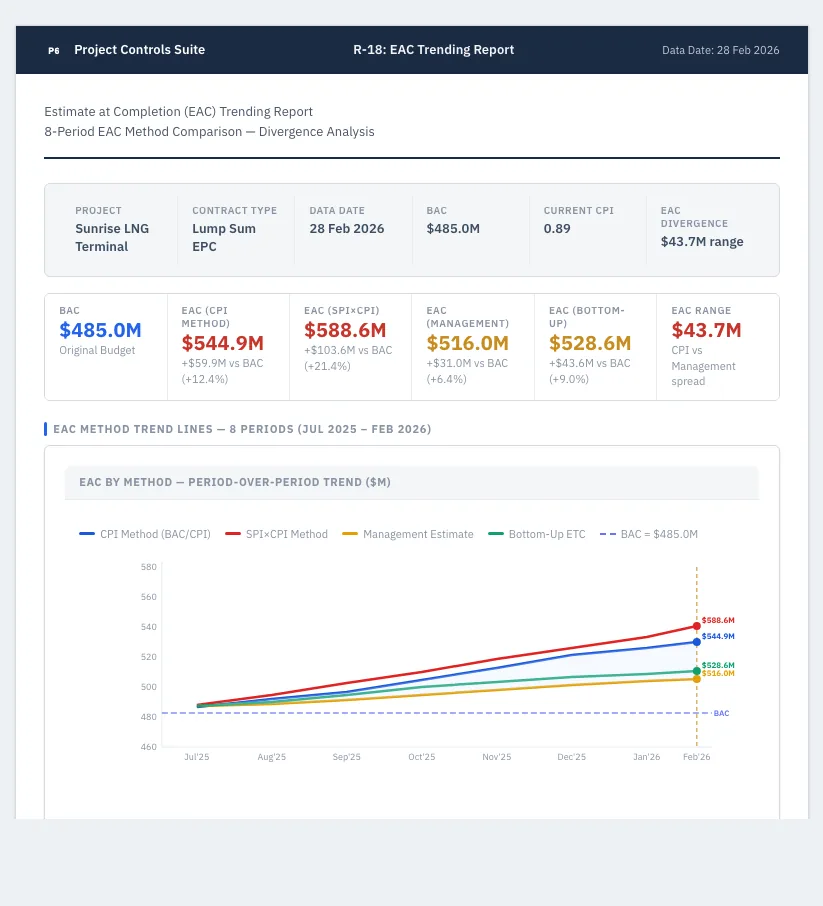
EAC Trending
Is the estimate at completion getting better or worse across the last eight update cycles?
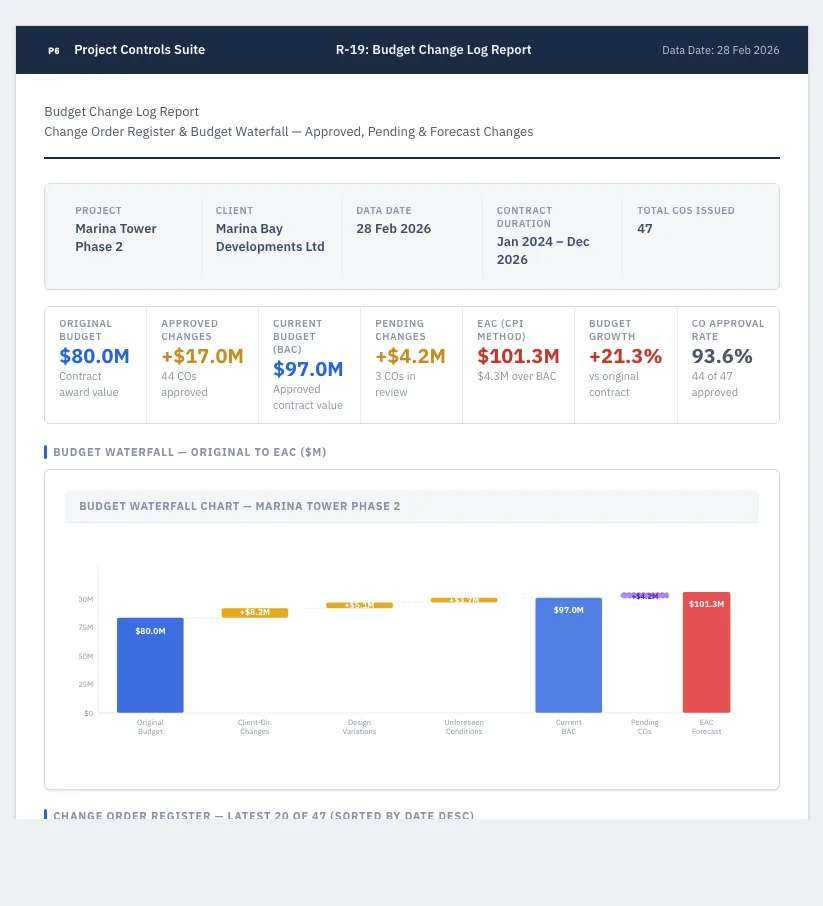
Budget Change Log
Every change to the budget — original, approved, pending, forecast — as a full audit trail.
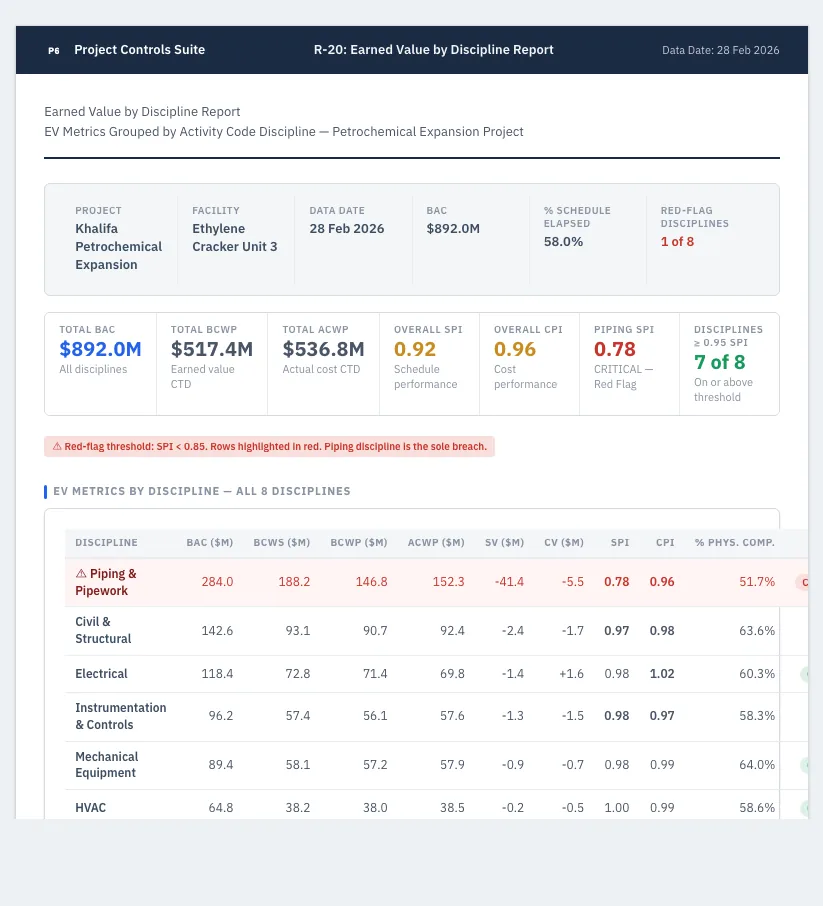
EV by Discipline / Package
Earned value split by discipline — civil, mechanical, electrical — so every lead owns their own numbers.
Phase 4 — Resources
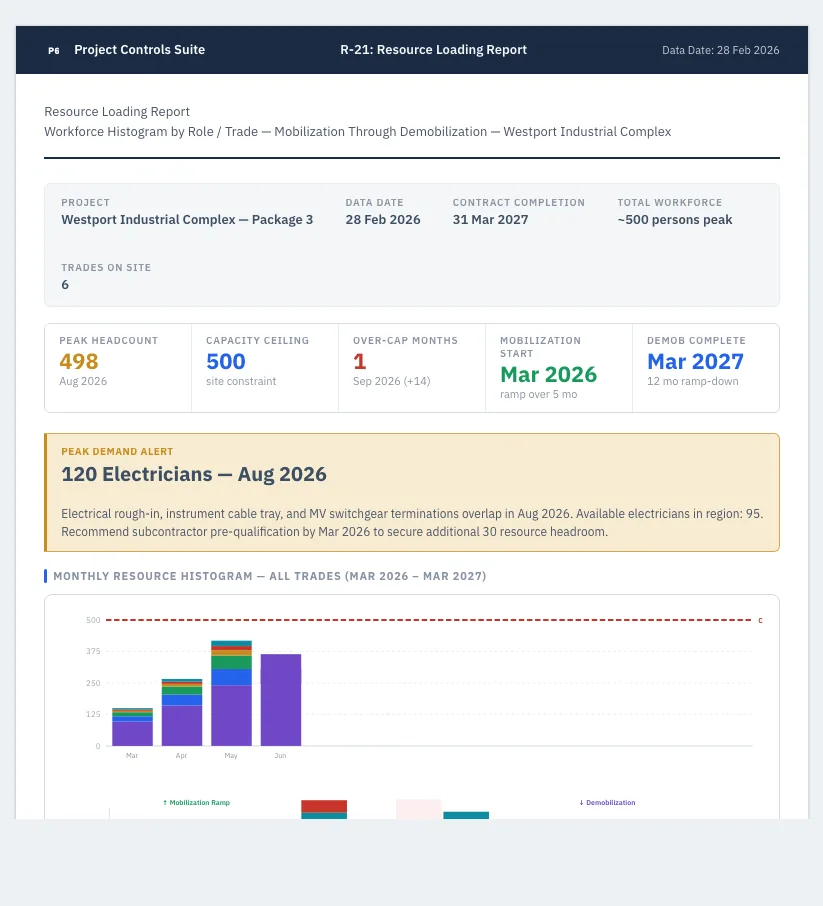
Resource Loading
The demand profile by role and month — peaks, valleys, mobilisation and demobilisation timing.
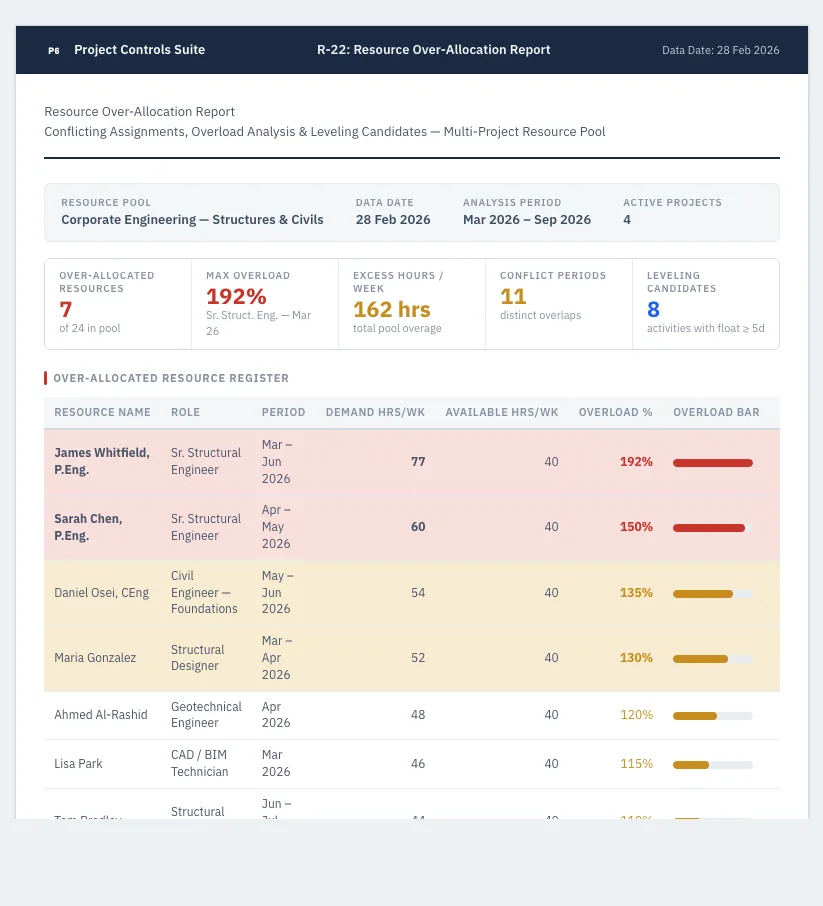
Resource Over-Allocation
Who is assigned more work than they can do, how big is the overload, and which projects compete?
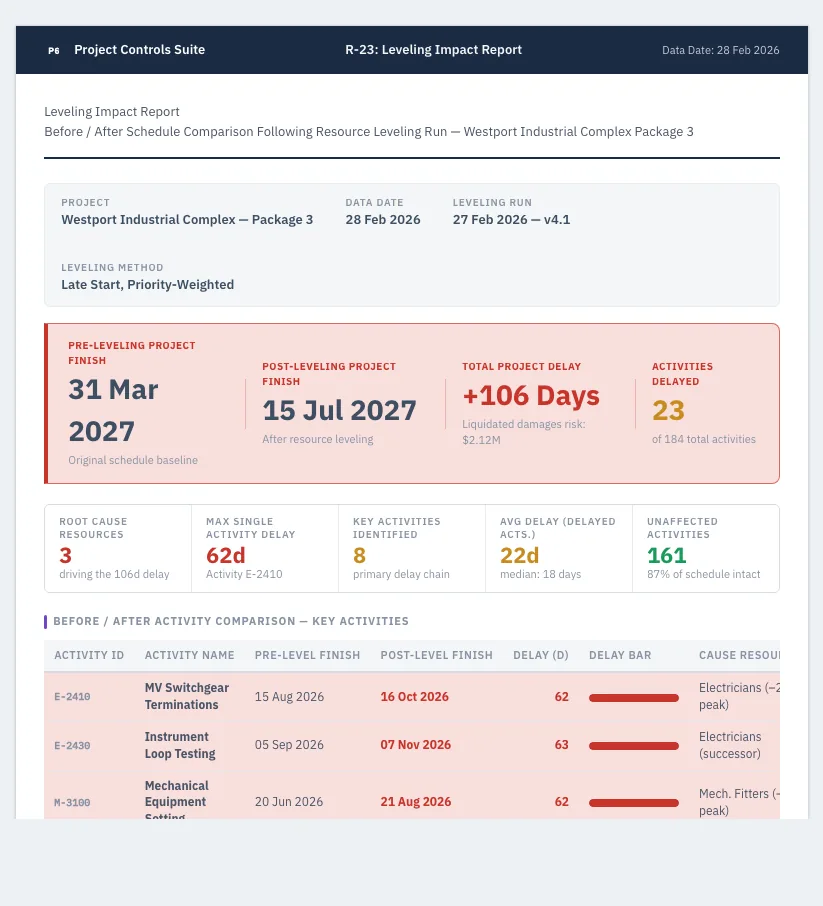
Resource Leveling Impact
If we level resources, what happens to the end date — and which activities move, by how much?
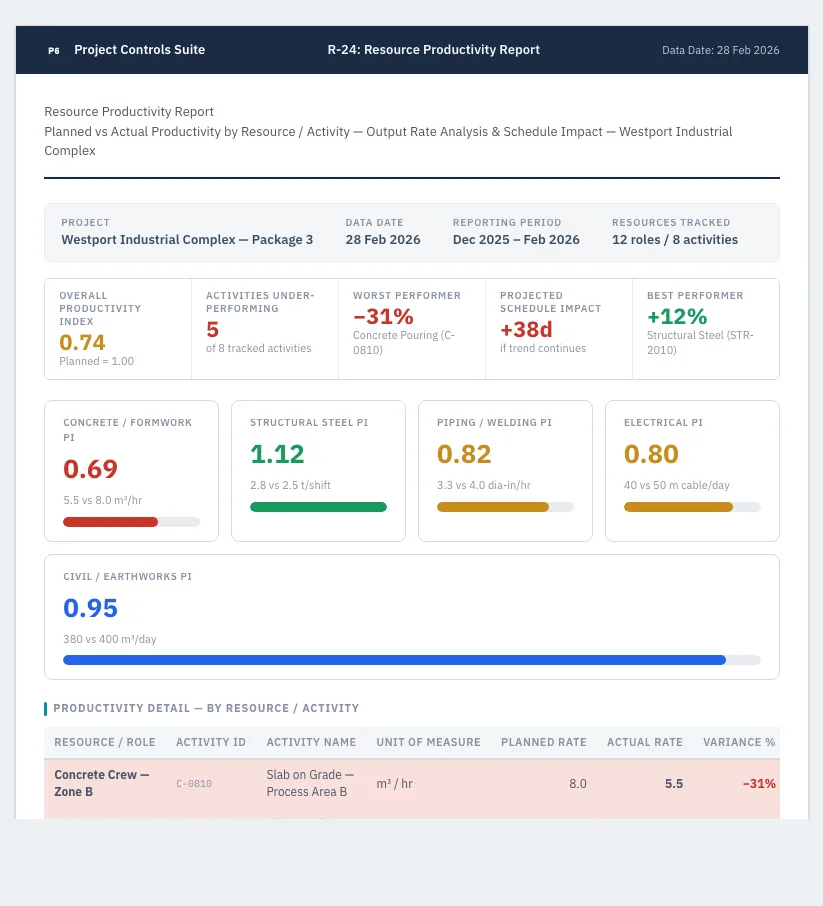
Resource Productivity
Are we achieving planned productivity? Actual hours per unit against the estimate.
Phase 5 — Risk & Recovery
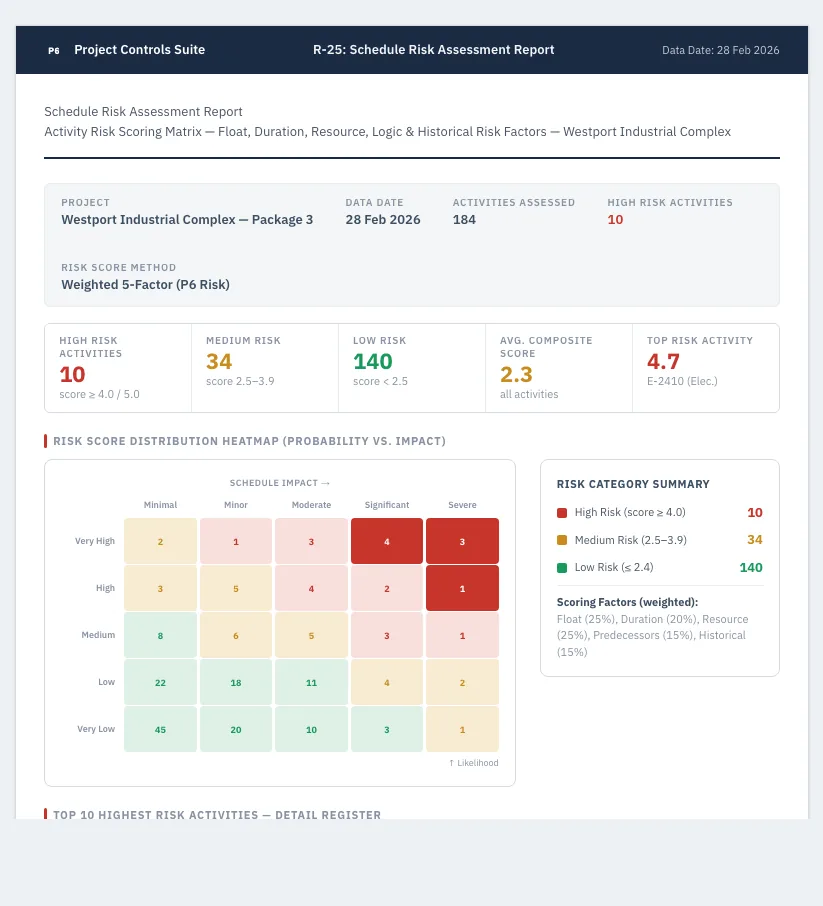
Schedule Risk Assessment
Which activities carry the highest schedule risk — by float, duration, resource dependency and history?
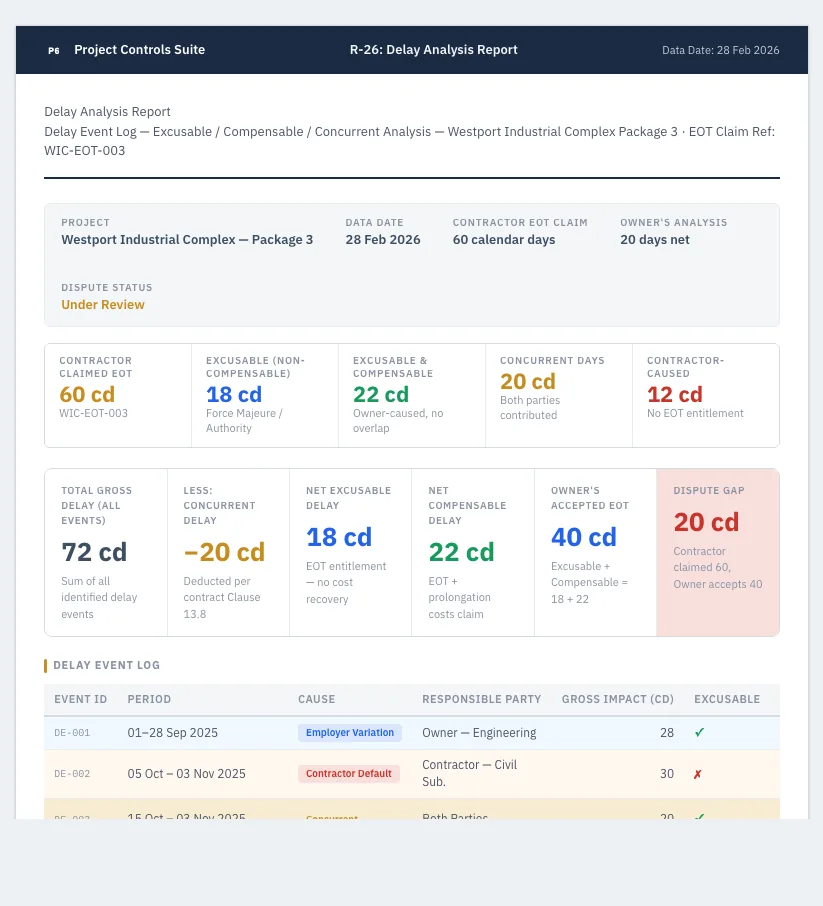
Delay Analysis
45 days late: what caused it, was it concurrent, was it excusable? The evidence for an EOT claim.
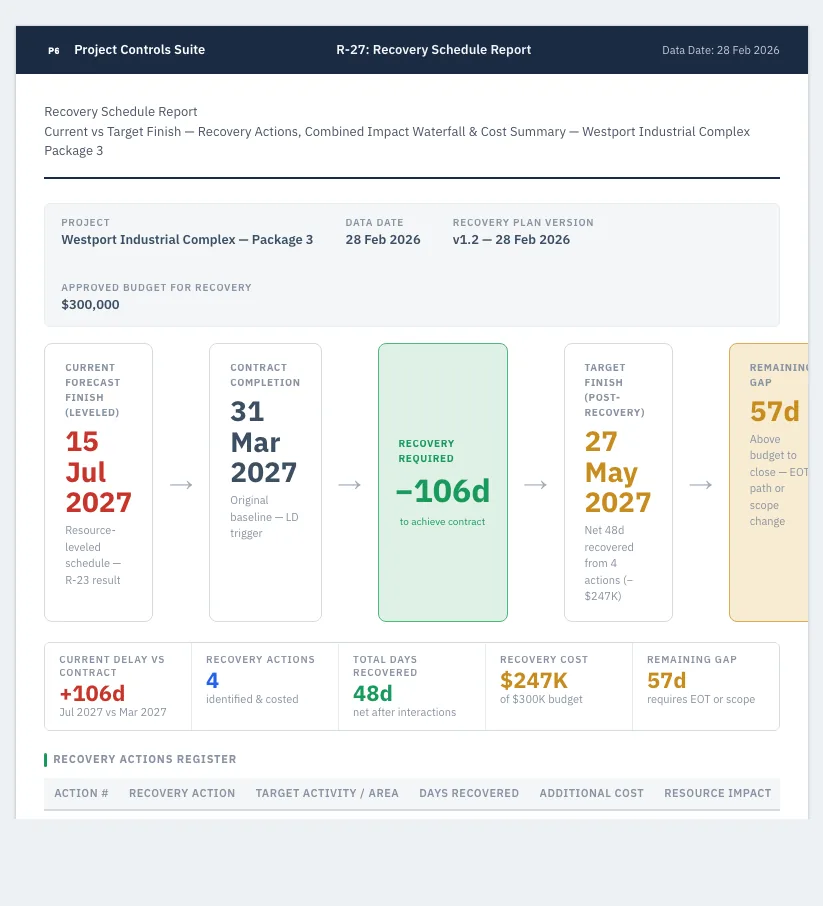
Recovery Schedule
We are behind. Extra crews, weekend work, re-sequencing — what does each option actually buy us?
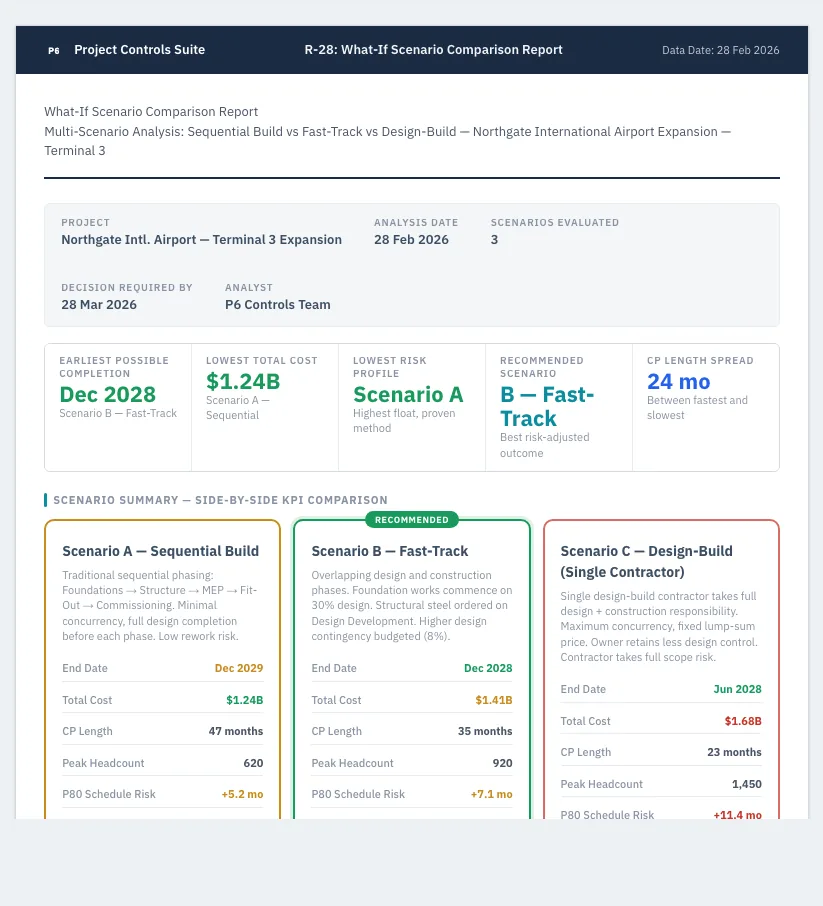
What-If Scenario Comparison
Three possible paths forward, side by side — dates, cost, resource impact, risk.
Phase 6 — Quality & Compliance
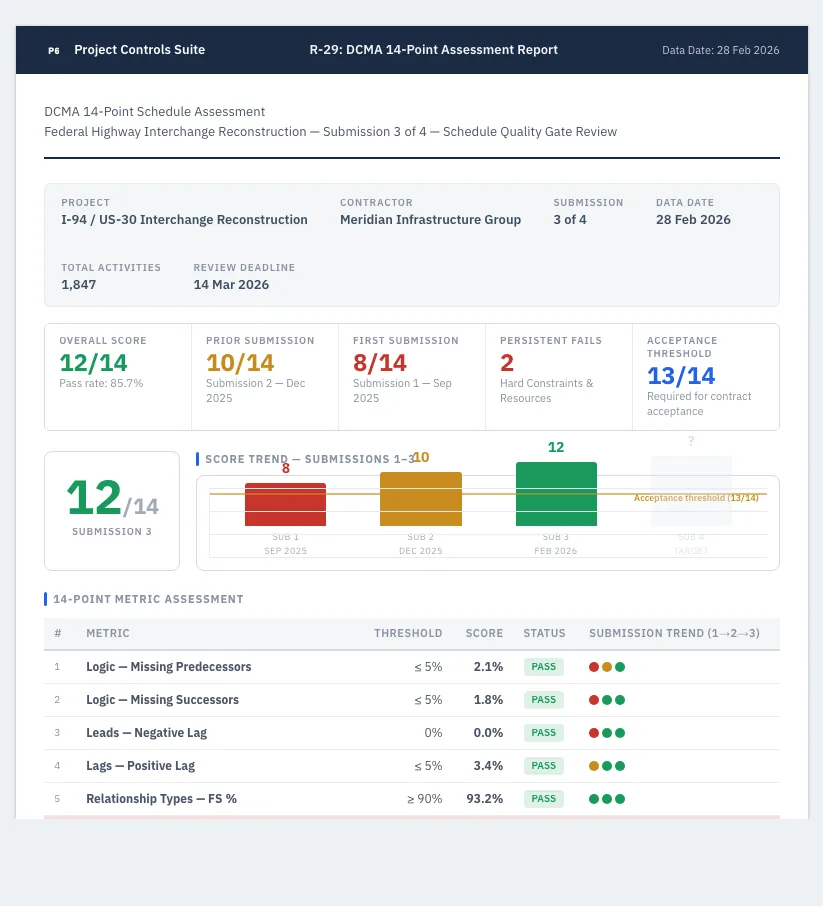
DCMA 14-Point Assessment
Each of the fourteen metrics: the threshold, our score, and exactly which activities fail.
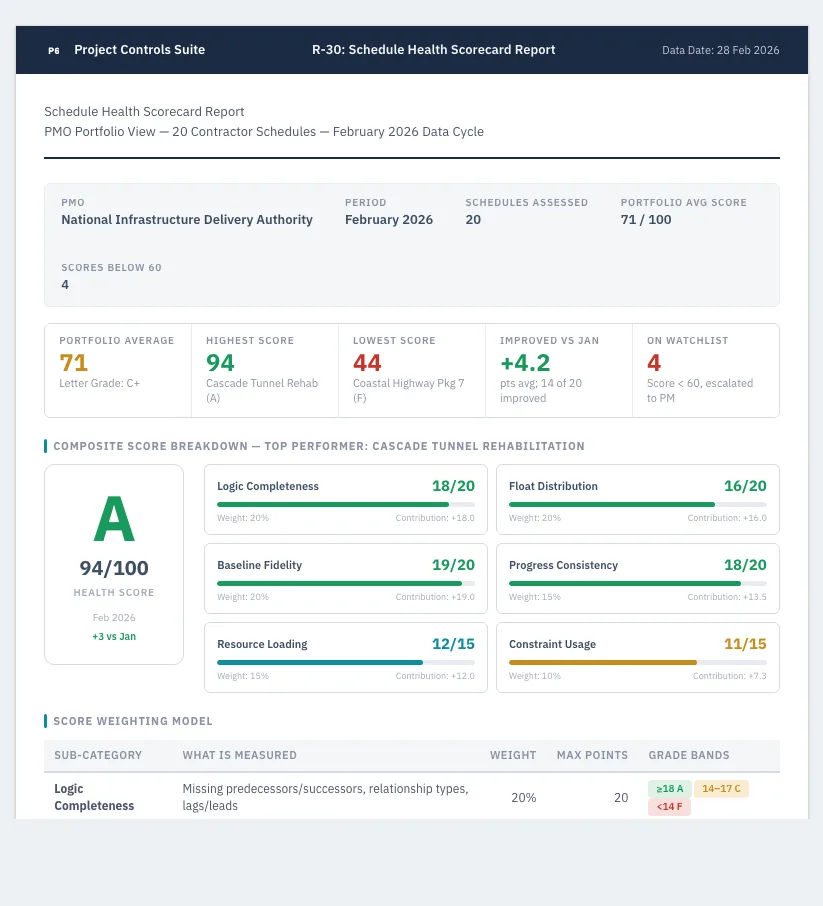
Schedule Health Scorecard
One score for schedule health — logic quality, baseline fidelity, progress realism. A credit score for the schedule.
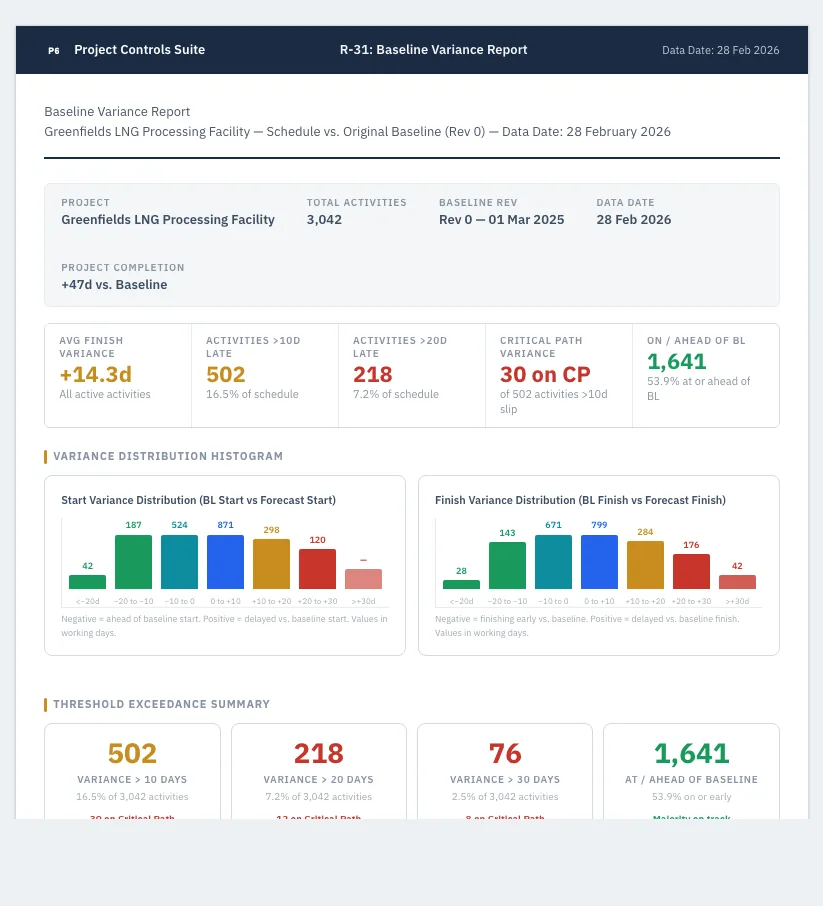
Baseline Variance
How far has the schedule drifted from baseline, which activities moved most, and is the drift accelerating?
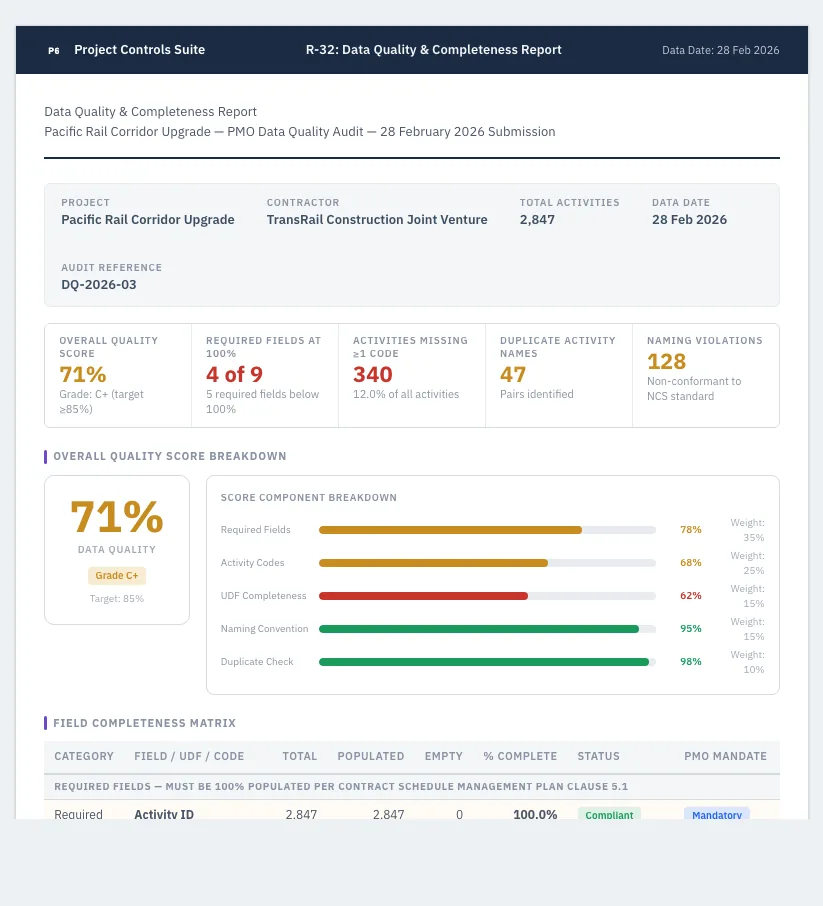
Data Quality & Completeness
Are required fields populated, UDFs filled, activity codes assigned? Data governance, measured.
Phase 7 — Closeout
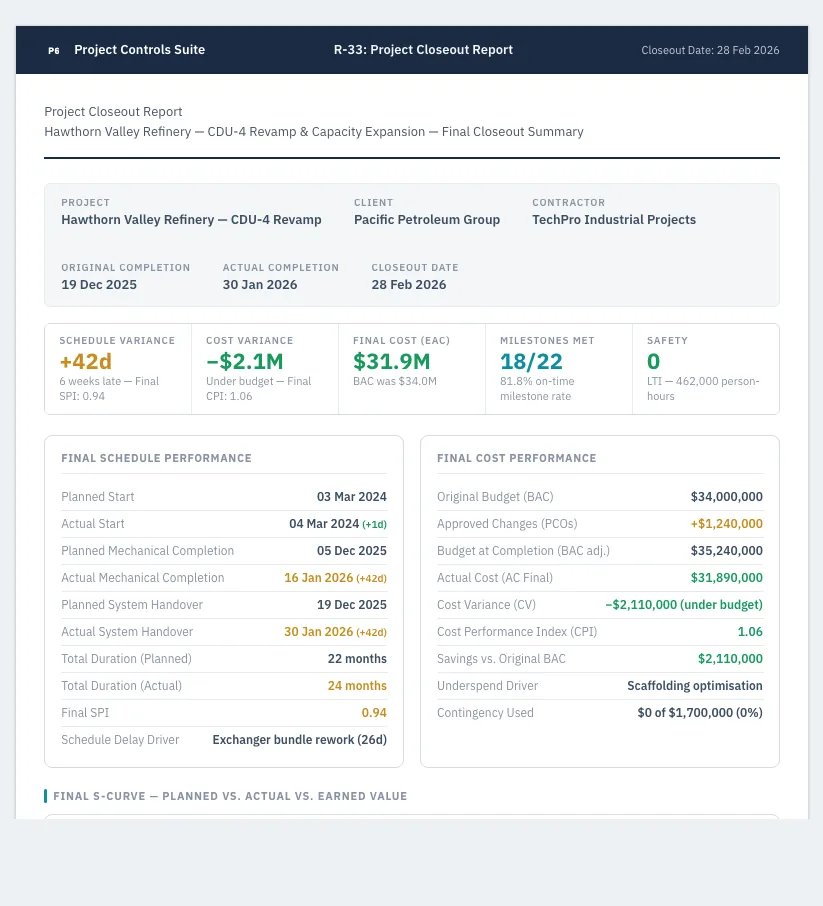
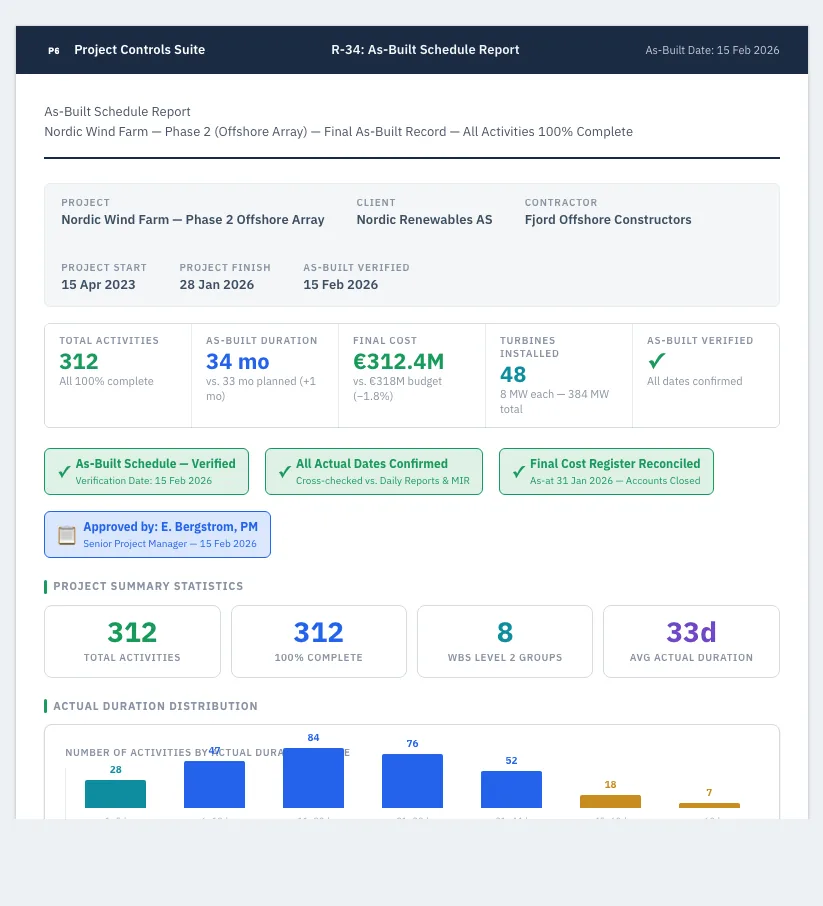
See three of these on your own data
A pilot takes a copy of your database and returns a handful of these reports populated with your projects — the fastest way to judge fit.